

- Updated:
- Published:
How operators should benchmark affiliate ROAS, CPA per FTD and RevShare without mixing partner payouts with true CAC

Two operators report 4x ROAS on affiliate traffic in the same week. One counts gross gaming revenue against last month’s invoice. The other uses 90-day net gaming revenue on a qualified-FTD cohort, net of clawbacks. Same label, different math. Without five definitions locked first, any headline benchmark is noise.
Blask does not publish affiliate CPA or ROAS. The article sets a benchmark frame — not a rate card — and uses Blask CEB, BAP, and licence-split data for market context: earning baselines, competitive density, and onshore/offshore mix by GEO. Pair that with your cohort ledger and the targets survive a finance review.
| For the wider acquisition picture, see affiliate marketing in iGaming, CPA, RevShare, and true CAC in iGaming. |
The five definitions every benchmark needs
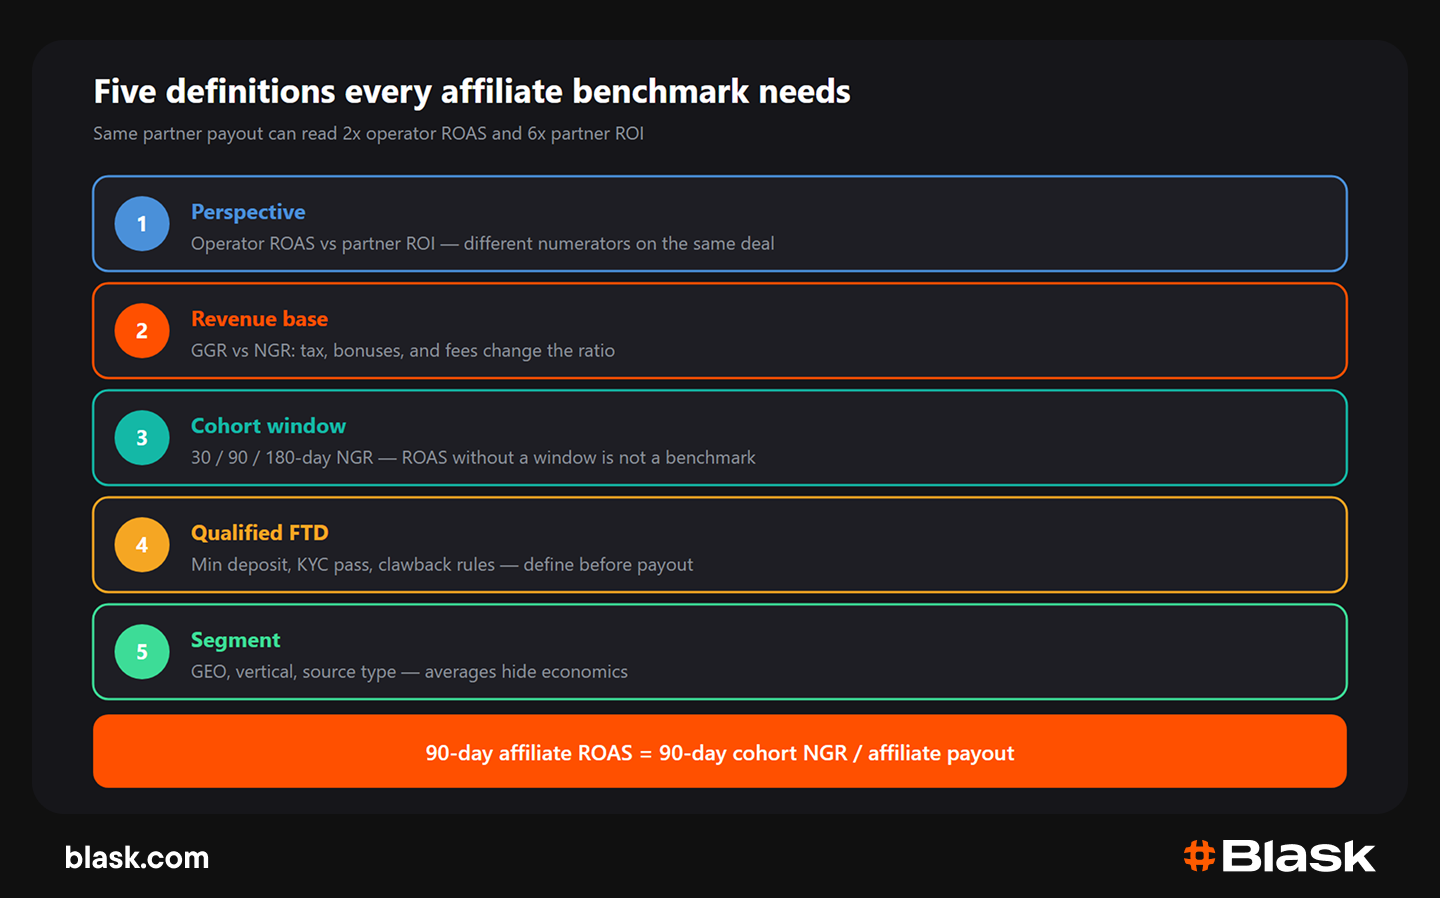
Before you compare internal numbers to an industry band, fix the definitions. The same partner payout can produce a 2x operator ROAS and a 6x partner ROI.
Five definitions every affiliate benchmark needs
- Perspective. Operator ROAS uses your revenue base divided by affiliate payout. Partner ROI uses their traffic cost or time in the denominator. A content site with organic traffic will always show a higher ROI than your ROAS on the same deal.
- Revenue base. GGR includes stakes returned as wins. NGR strips bonuses, taxes, and fees depending on market rules. RevShare tiers tied to GGR look generous until you reconcile on NGR.
- Cohort window. A 30-day ROAS answers cash pacing. A 90-day ROAS answers tier economics. A 180-day window matters for casino-heavy cohorts. ROAS without a window is not a benchmark.
- Qualified FTD. Minimum deposit, KYC pass, no duplicate device, clawback window: define these before payout. Commission tiers often encode qualification rules; your benchmark must match the tier contract, not the dashboard default.
- Segment. GEO, product (sports vs casino), partner type (content vs paid media), and traffic source belong in separate rows. A UK sportsbook average hides a Brazil lottery-heavy mix and a Germany offshore-skewed search market.
| 90-day affiliate ROAS = 90-day cohort NGR ÷ affiliate payout |
Affiliate CPA is one line inside true CAC. Blended CAC folds in promos, fraud reserves, and ops. Paid CAC is a marginal bid signal. None of them replace a qualified-FTD affiliate benchmark.
Benchmark framework: what to measure
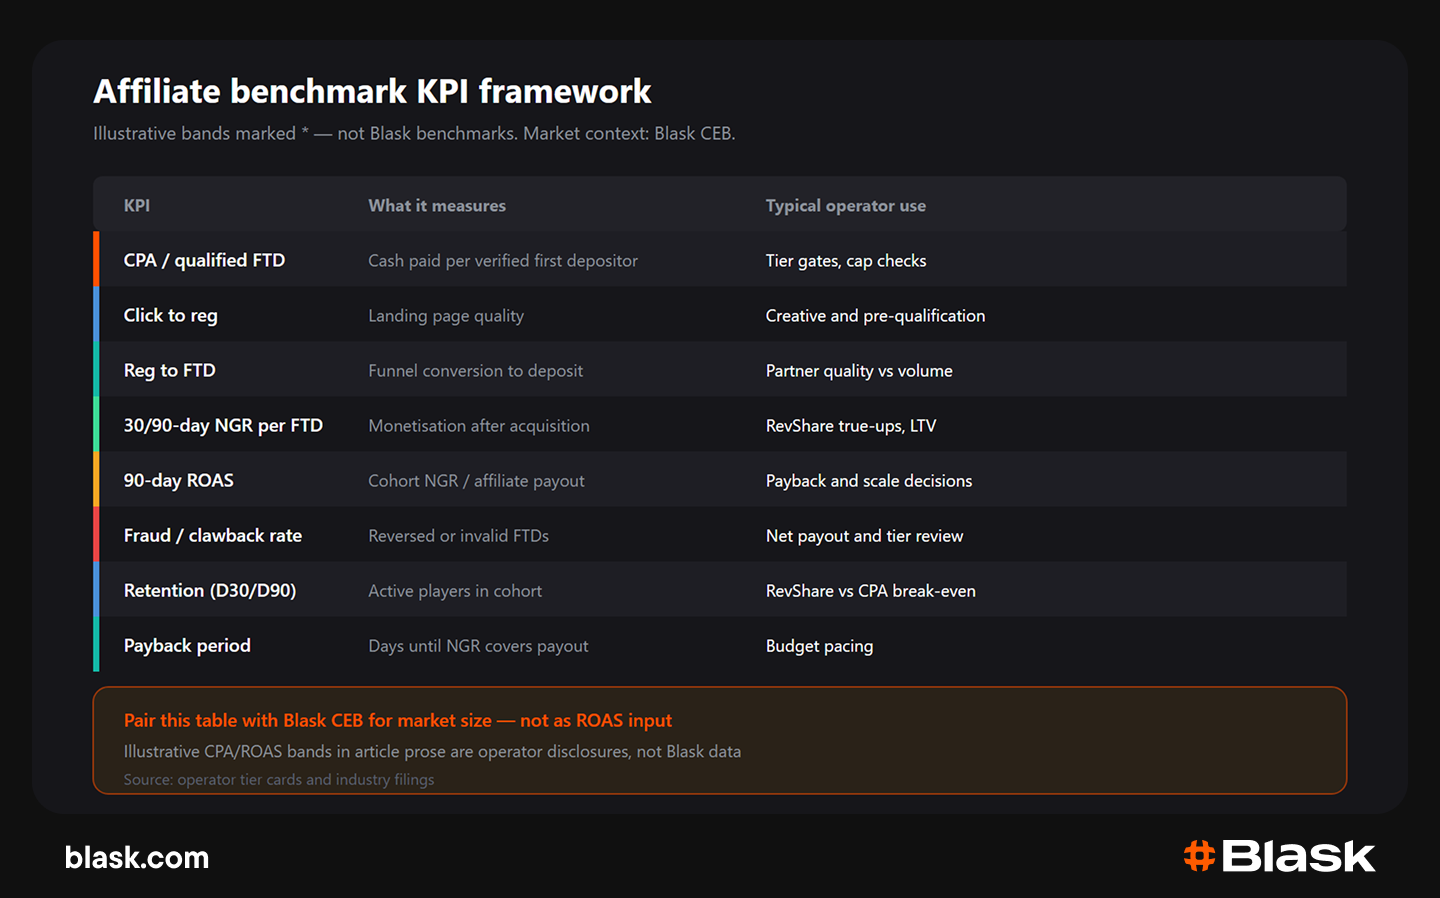
Use one table across partners. Fill the “your target” column from your ledger. Where public disclosures exist, calibrate magnitude; where they do not, treat industry bands as illustrative.
Affiliate benchmark KPI framework
| KPI | Operator question | Illustrative band* |
| CPA per qualified FTD | Is this partner inside the tier cap? | $80–$350 by GEO and vertical |
| Click → registration | Is the landing page pre-qualifying? | 8–25% content; 3–12% paid |
| Registration → FTD | Is traffic real or incent-heavy? | 15–45% regulated; wider in grey |
| 90-day NGR per FTD | Does RevShare true-up hold? | Highly segment-specific |
| 90-day ROAS (NGR ÷ payout) | Can we scale spend? | 1.0–2.5x casino; 1.2–3.0x sports |
| Fraud / clawback rate | What is net payout? | 2–15% of attributed FTDs |
| D30 / D90 retention | CPA or RevShare? | Set vs your LTV curve |
| Payback period | Budget pacing | 30–120 days typical |
Illustrative ranges from operator disclosures and tier structures cited in industry filings. Not sourced from Blask.
CEB belongs beside this table as market context. It projects the revenue pool a market should support at current demand — not a single partner payout input. Strong 90-day ROAS with revenue below CEB points to monetisation or product mix, not affiliate price.
CPA, RevShare and hybrid on one cohort
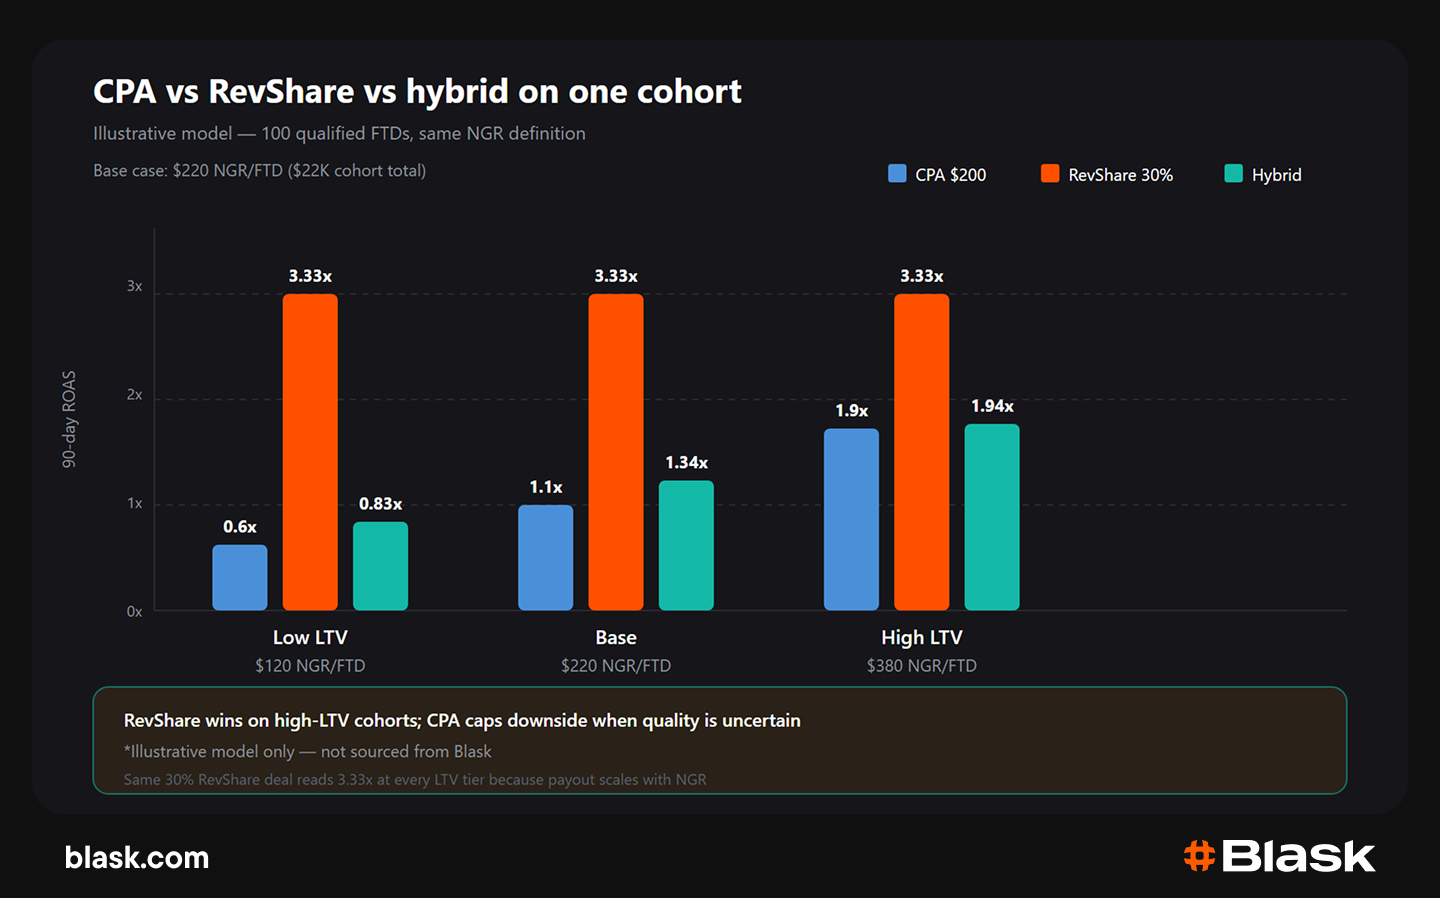
Run all three models on identical qualified FTDs and the same NGR definition. The chart below is an illustrative model: 100 qualified FTDs, CPA $200, RevShare 30%, hybrid $120 plus 20% RevShare.
CPA vs RevShare vs hybrid on one cohort
| Scenario | 90-day NGR / FTD | CPA payout | RevShare payout | Hybrid payout | 90-day ROAS (CPA / RevShare / hybrid) |
| Low LTV | $120 | $20 000 | $3 600 | $14 400 | 0.60x / 3.33x / 0.83x |
| Base | $220 | $20 000 | $6 600 | $16 400 | 1.10x / 3.33x / 1.34x |
| High LTV | $380 | $20 000 | $11 400 | $19 600 | 1.90x / 3.33x / 1.94x |
CPA caps operator downside when player quality is uncertain. Payback is visible on day zero; weak cohorts destroy ROAS fast — 0.60x in the low-LTV row.
RevShare wins when NGR per FTD runs high. At $380 NGR per FTD, the same 30% deal delivers 3.33x ROAS against a $6 600 payout.
Hybrid splits the risk. The base CPA covers acquisition cost; RevShare aligns on longer-lived players. That fits partners with proven traffic but uneven retention.
Model choice follows cohort quality, not the other way around. Germany’s search demand skews offshore; Brazil’s regulated onshore base behaves differently again. Same formula, different player economics.
Why GEO changes affiliate economics
Affiliate benchmarks are not portable across markets. Regulation sets what you can pay and how; demand and competition set what you earn per acquired player. Blask CEB and BAP describe that second layer — they do not replace your affiliate contracts, but they explain why a partner who delivers 2x ROAS in Brazil may barely break even on identical terms in Germany.
Brazil and the UK still offer the largest CEB pools here, but three of four markets lost search demand year-on-year — tier math set in 2025 is already stale.
Search demand: YoY change
Before you lock CPA caps, look at which pools are growing. July 2026 search demand vs July 2025 splits this set cleanly: Germany surged (+72%), while Brazil (−17%), New Jersey (−11%), and the UK (−6%) all cooled. Affiliate economics tighten faster in shrinking markets — partners compete for a smaller search pool, and ROAS targets that were held last year may not scale at the same payout.
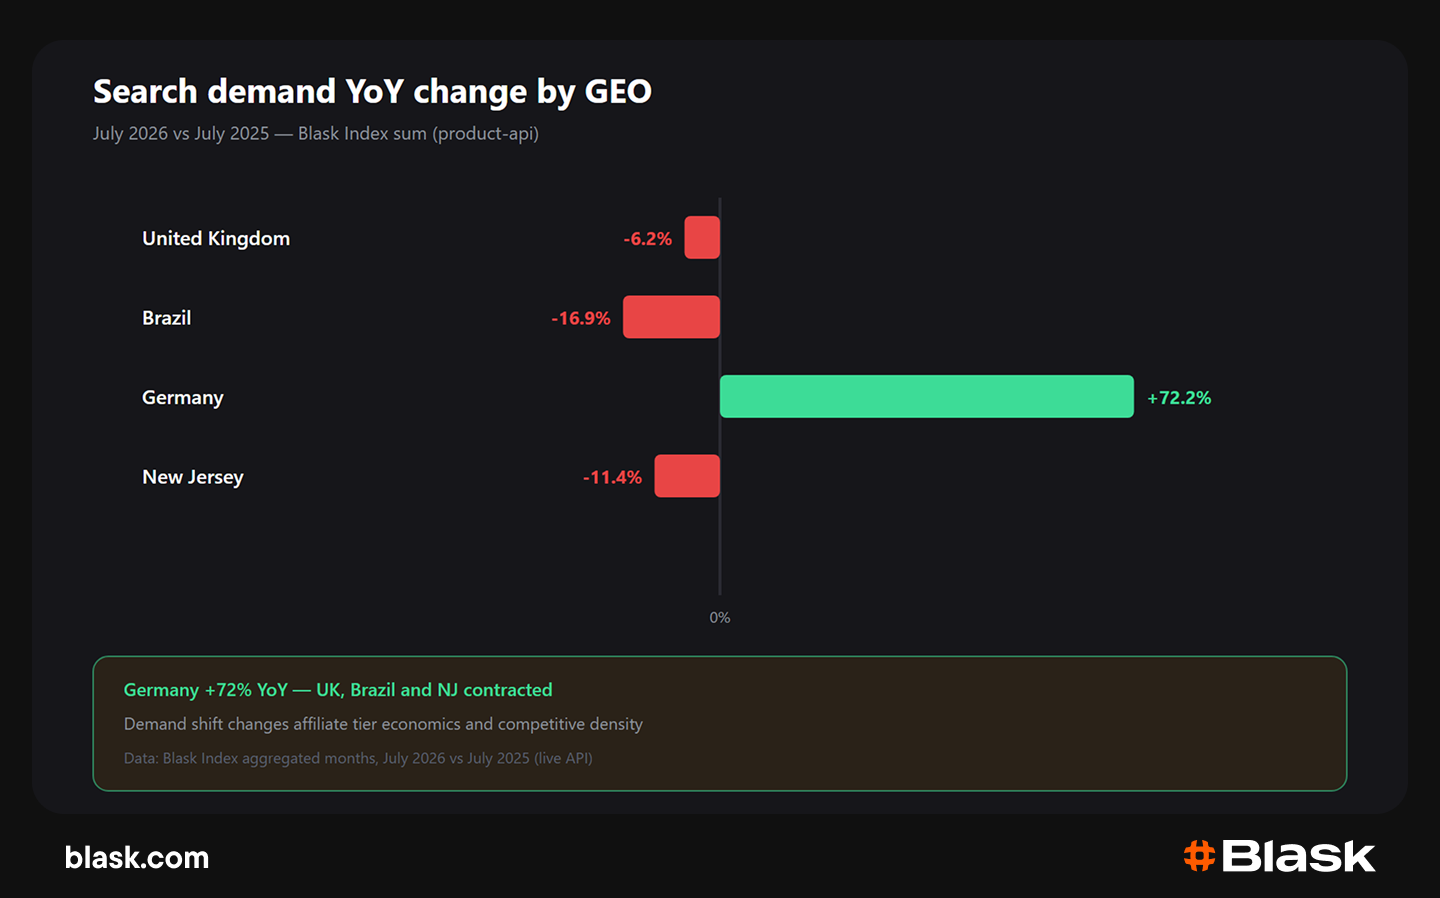
Search demand, YoY change, in 4 GEOs: the United Kingdom, Brazil, Germany, and New Jersey (the USA).
Competitive earning baseline (CEB)
CEB projects how large the market should be at current demand — the revenue ceiling behind tier negotiations. Brazil leads at ~$1.08B, the UK follows at ~$990M, New Jersey sits near $490M, and Germany at ~$240M is the smallest pool in this comparison. The tension: Brazil and the UK offer the largest earning baselines while demand is falling; Germany offers less total revenue but the fastest-growing attention. Affiliate ROAS targets need both numbers — market size and market direction.
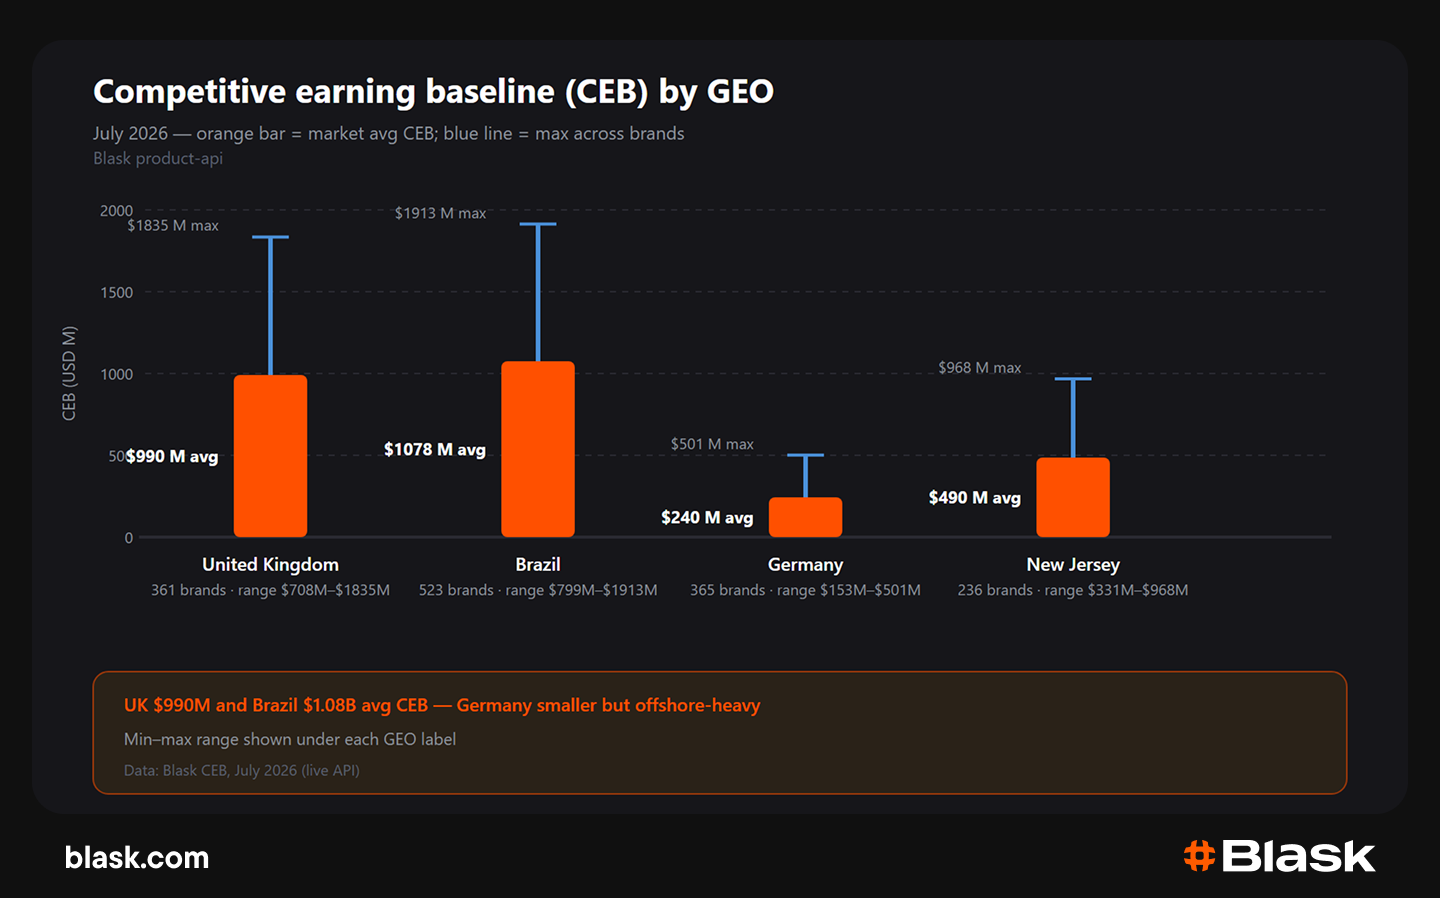
CEB in four GEOs: the United Kingdom, Brazil, Germany, and New Jersey (the USA)
Competitive density: tracked brands
Brand count is competitive pressure in affiliate terms. Brazil tracks 523 brands — the densest field here — against 361 in the UK, 365 in Germany, and 236 in New Jersey. More brands usually mean tighter economics unless demand is rising fast enough to absorb new entrants. Germany is the exception in this set: high density plus surging demand. Brazil is the opposite: the noisiest market and a shrinking pool.
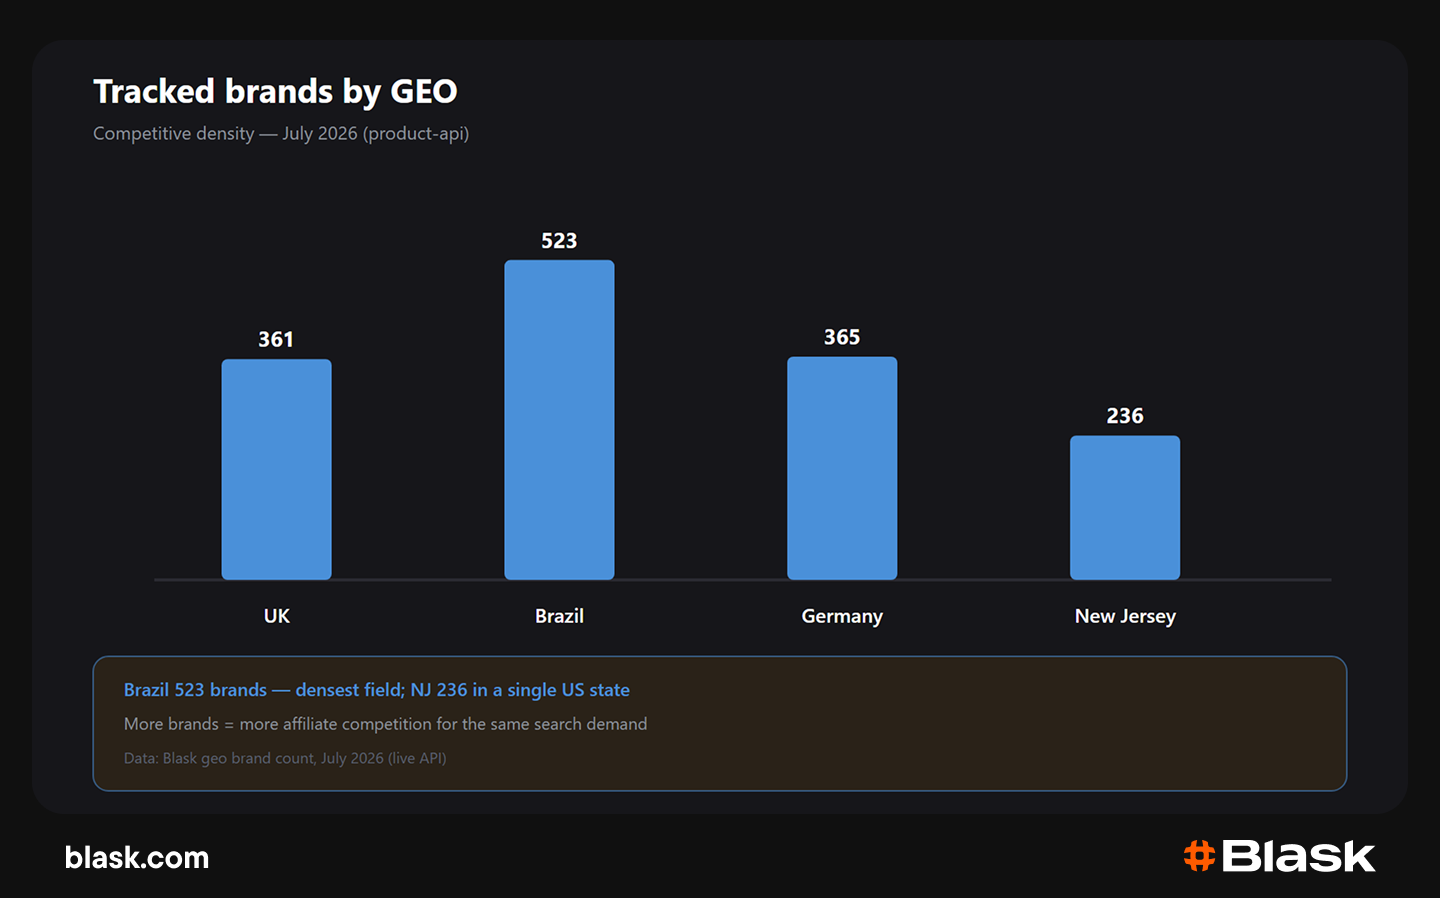
The amount of brands in four GEOs: the UK, Brazil, Germany, and New Jersey (the US)
Category demand mix
Product mix shifts affiliate economics as much as regulation. UK search skews the lottery; Brazil is betting-led; Germany pairs lottery-heavy search with an offshore casino tail — not a sports-led mix. A sportsbook CPA benchmark applied to lottery content partners will miss — and a RevShare tier tuned to casino LTV will misread a betting-heavy Brazilian cohort. Segment before you compare FTD value across GEOs.
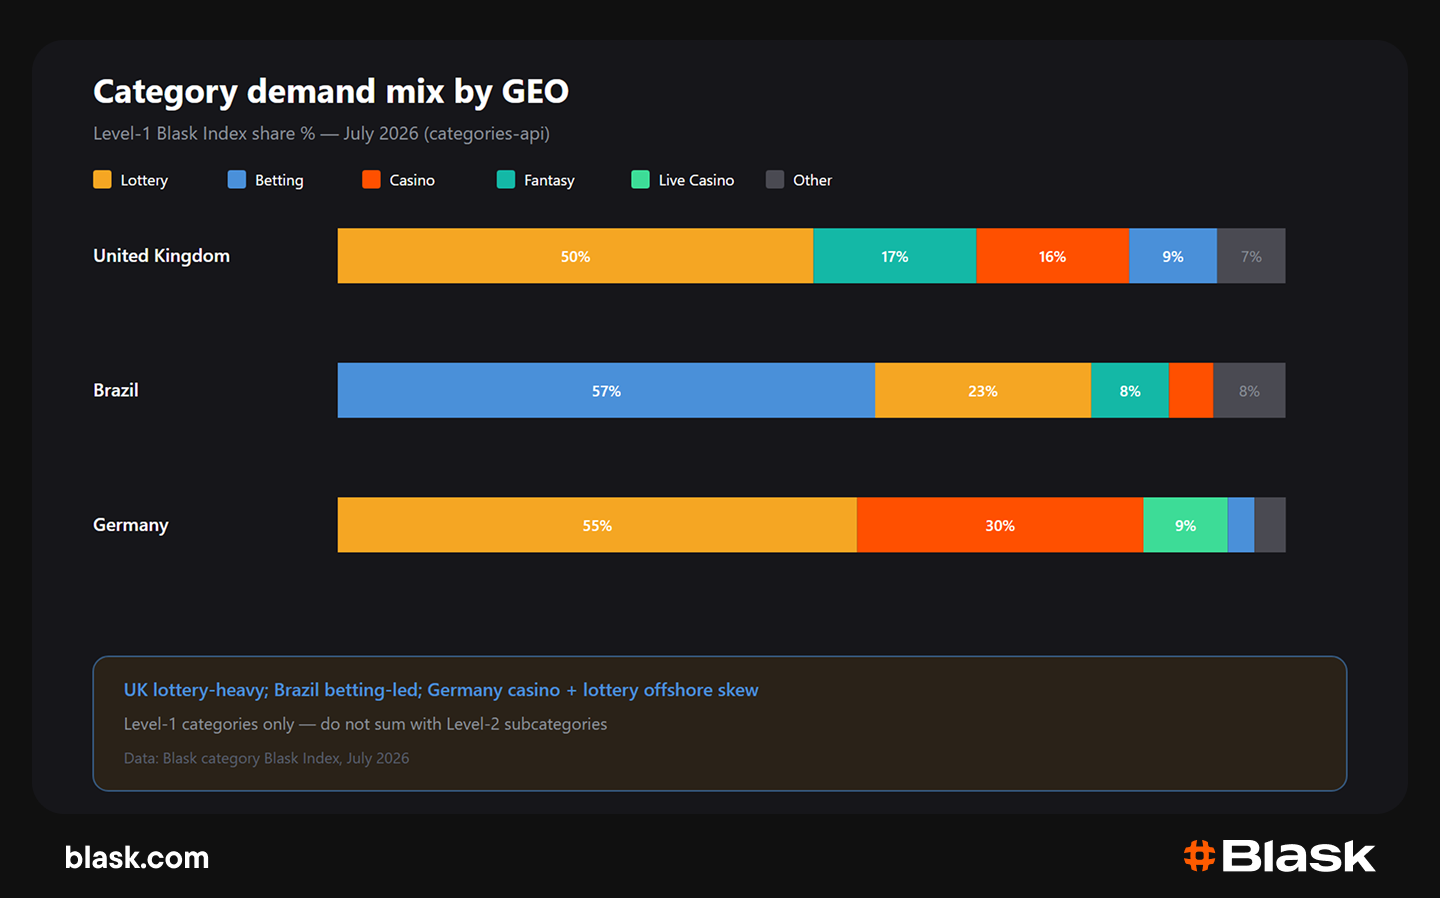
Category demand differences between three countries
Onshore vs offshore search demand
Licence split is the chart that ties the country notes together. The UK and Brazil both show ~96% onshore attention — similar on the surface, different in affiliate math because product mix and regulation diverge. Germany inverts the pattern: two-thirds offshore, which explains why search demand can surge while licensed sportsbook affiliate structures stay fixed-fee. New Jersey sits at 69% onshore with a visible offshore tail. The same RevShare tier does not travel across these splits.
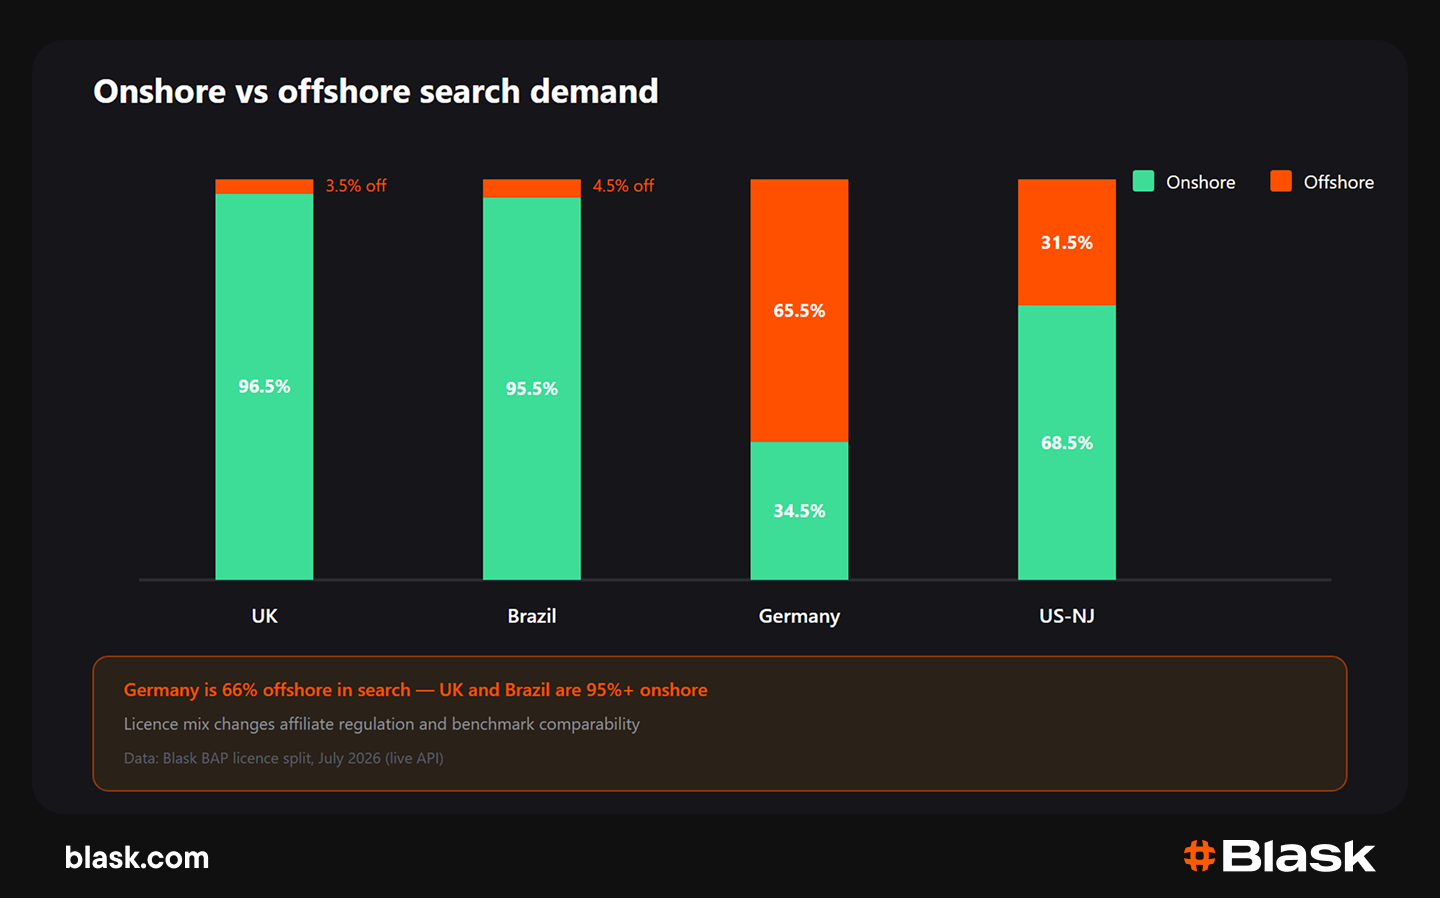
Onshore and offshore demand comparison by four GEOs
What a usable internal benchmark requires
A benchmark that finance will sign off on starts with a written qualified-FTD definition: minimum deposit, KYC, clawback days, excluded promos — matched to commission tier language. The NGR formula must be fixed per GEO (tax, bonus cost, payment fees) and identical in ROAS and RevShare true-ups.
Cohort windows (30 / 90 / 180 days) cannot mix across partners. Segment by GEO, product, and partner type; content, paid, and hybrid organic partners belong in separate rows. Reconcile payout to cohort NGR monthly and apply fraud and clawback before tier movement. Tier reviews work off retention curves, not FTD volume alone. Blask CEB helps separate under-performance driven by price from under-performance driven by product.
Red flags in benchmark reports
The usual failures are:
- ROAS with no cohort window;
- CPA mixed into blended CAC;
- RevShare on GGR while finance reports NGR;
- one average row that hides Germany’s offshore skew.
If a vendor sells average affiliate ROAS as a single number, ask for the five definitions from the opening section. No answer means the benchmark is not comparable.
FAQ
What is a good ROAS for iGaming affiliates?
There is no universal good ROAS. On 90-day NGR, many regulated operators treat 1.2–2.5x as a planning band for sports and 1.0–2.0x for casino, before overhead. Your floor depends on promo load and tax. Measure yours on qualified FTDs first.
How is affiliate ROAS calculated?
Operator affiliate ROAS = cohort NGR attributable to affiliate-acquired players ÷ affiliate payout for that cohort in the same window. Use NGR unless your contract explicitly states GGR.
What is a typical CPA per FTD?
Public tier cards span roughly $80–$350 per qualified FTD depending on GEO and vertical. Treat any single figure as illustrative. Your tier history beats industry averages.
CPA or RevShare for operators?
CPA when player quality is unproven or regulation caps variable fees. RevShare when retention and NGR per FTD are stable. Hybrid when the partner has a track record but cohort variance is high.
How long should payback be measured?
Match the payout model. CPA payback often uses 30–60 days; RevShare and hybrid deals need 90 days minimum, often 180 for casino.
What makes an FTD qualified?
Minimum deposit, passed KYC, unique payment method, no self-exclusion hit, and survival through the clawback window defined in the contract. Align with your FTD strategy definitions.
Bottom line
iGaming affiliate benchmarks only work once perspective, revenue base, cohort window, qualified FTD, and segment are fixed — and affiliate CPA is kept separate from true CAC.
CPA, RevShare, and hybrid answer different risk questions; the cohort table above shows why one model can read 0.60x while another reads 3.33x on the same players.
Blask reads market size and competitive pressure. Your ledger sets affiliate ROAS and CPA targets. The open question for most operators is not whether affiliate economics work in aggregate — it is whether their tier math survives the next finance review once clawbacks, promo load, and licence cost hit the same spreadsheet.
Want to find iGaming affiliate benchmarks? Book a demo.