- Updated:
- Published:
How to read a market like an analyst: Blask’s Brands page
Every iGaming market is a moving target. Regulation shifts. New operators arrive. Player demand peaks around a football final and disappears by Monday. The question isn’t whether the market is changing — it always is — but whether you have the right instrument to see it clearly.
Blask’s Brands page was built for exactly that. It aggregates the country’s signals that matter — player interest, brand positioning, revenue potential, regulatory status — and presents them in a single country-level dashboard that updates hourly.
Here is what the Country page contains, how each element works, and what has changed since the platform’s last major update.
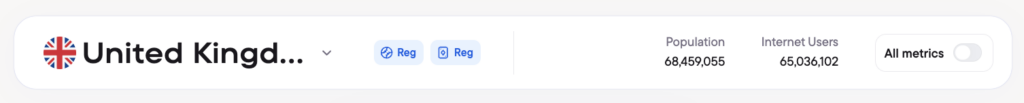
Regulation status: three categories that shape everything
Before any metric, the page establishes the legal context. Each country carries one of three designations:
- Regulated. A government licensing framework exists. Operating requires a license and periodic reporting. The brands you see in the table are, in principle, playing by stated rules.
- Unregulated. No licensing requirement, no formal oversight. Entry costs are low; data certainty is also lower.


The distinction matters because the same Blask Index number reads differently in a regulated market versus a restricted one. A rising trend in Brazil (now regulated) and a rising trend in a restricted market are different investment signals.
Blask Index: the core metric
Blask Index is the platform’s foundational measurement — a proprietary indicator that quantifies player interest across an entire country or for individual brands within it. The methodology is rooted in Share of Search: Blask processes search queries at scale and converts them into a standardized, graphable number.
The index refreshes hourly. That cadence matters more than it might seem. A major operator’s bonus campaign, a Champions League knockout stage, a payment system outage — all of these register within the hour, not the next day’s report.
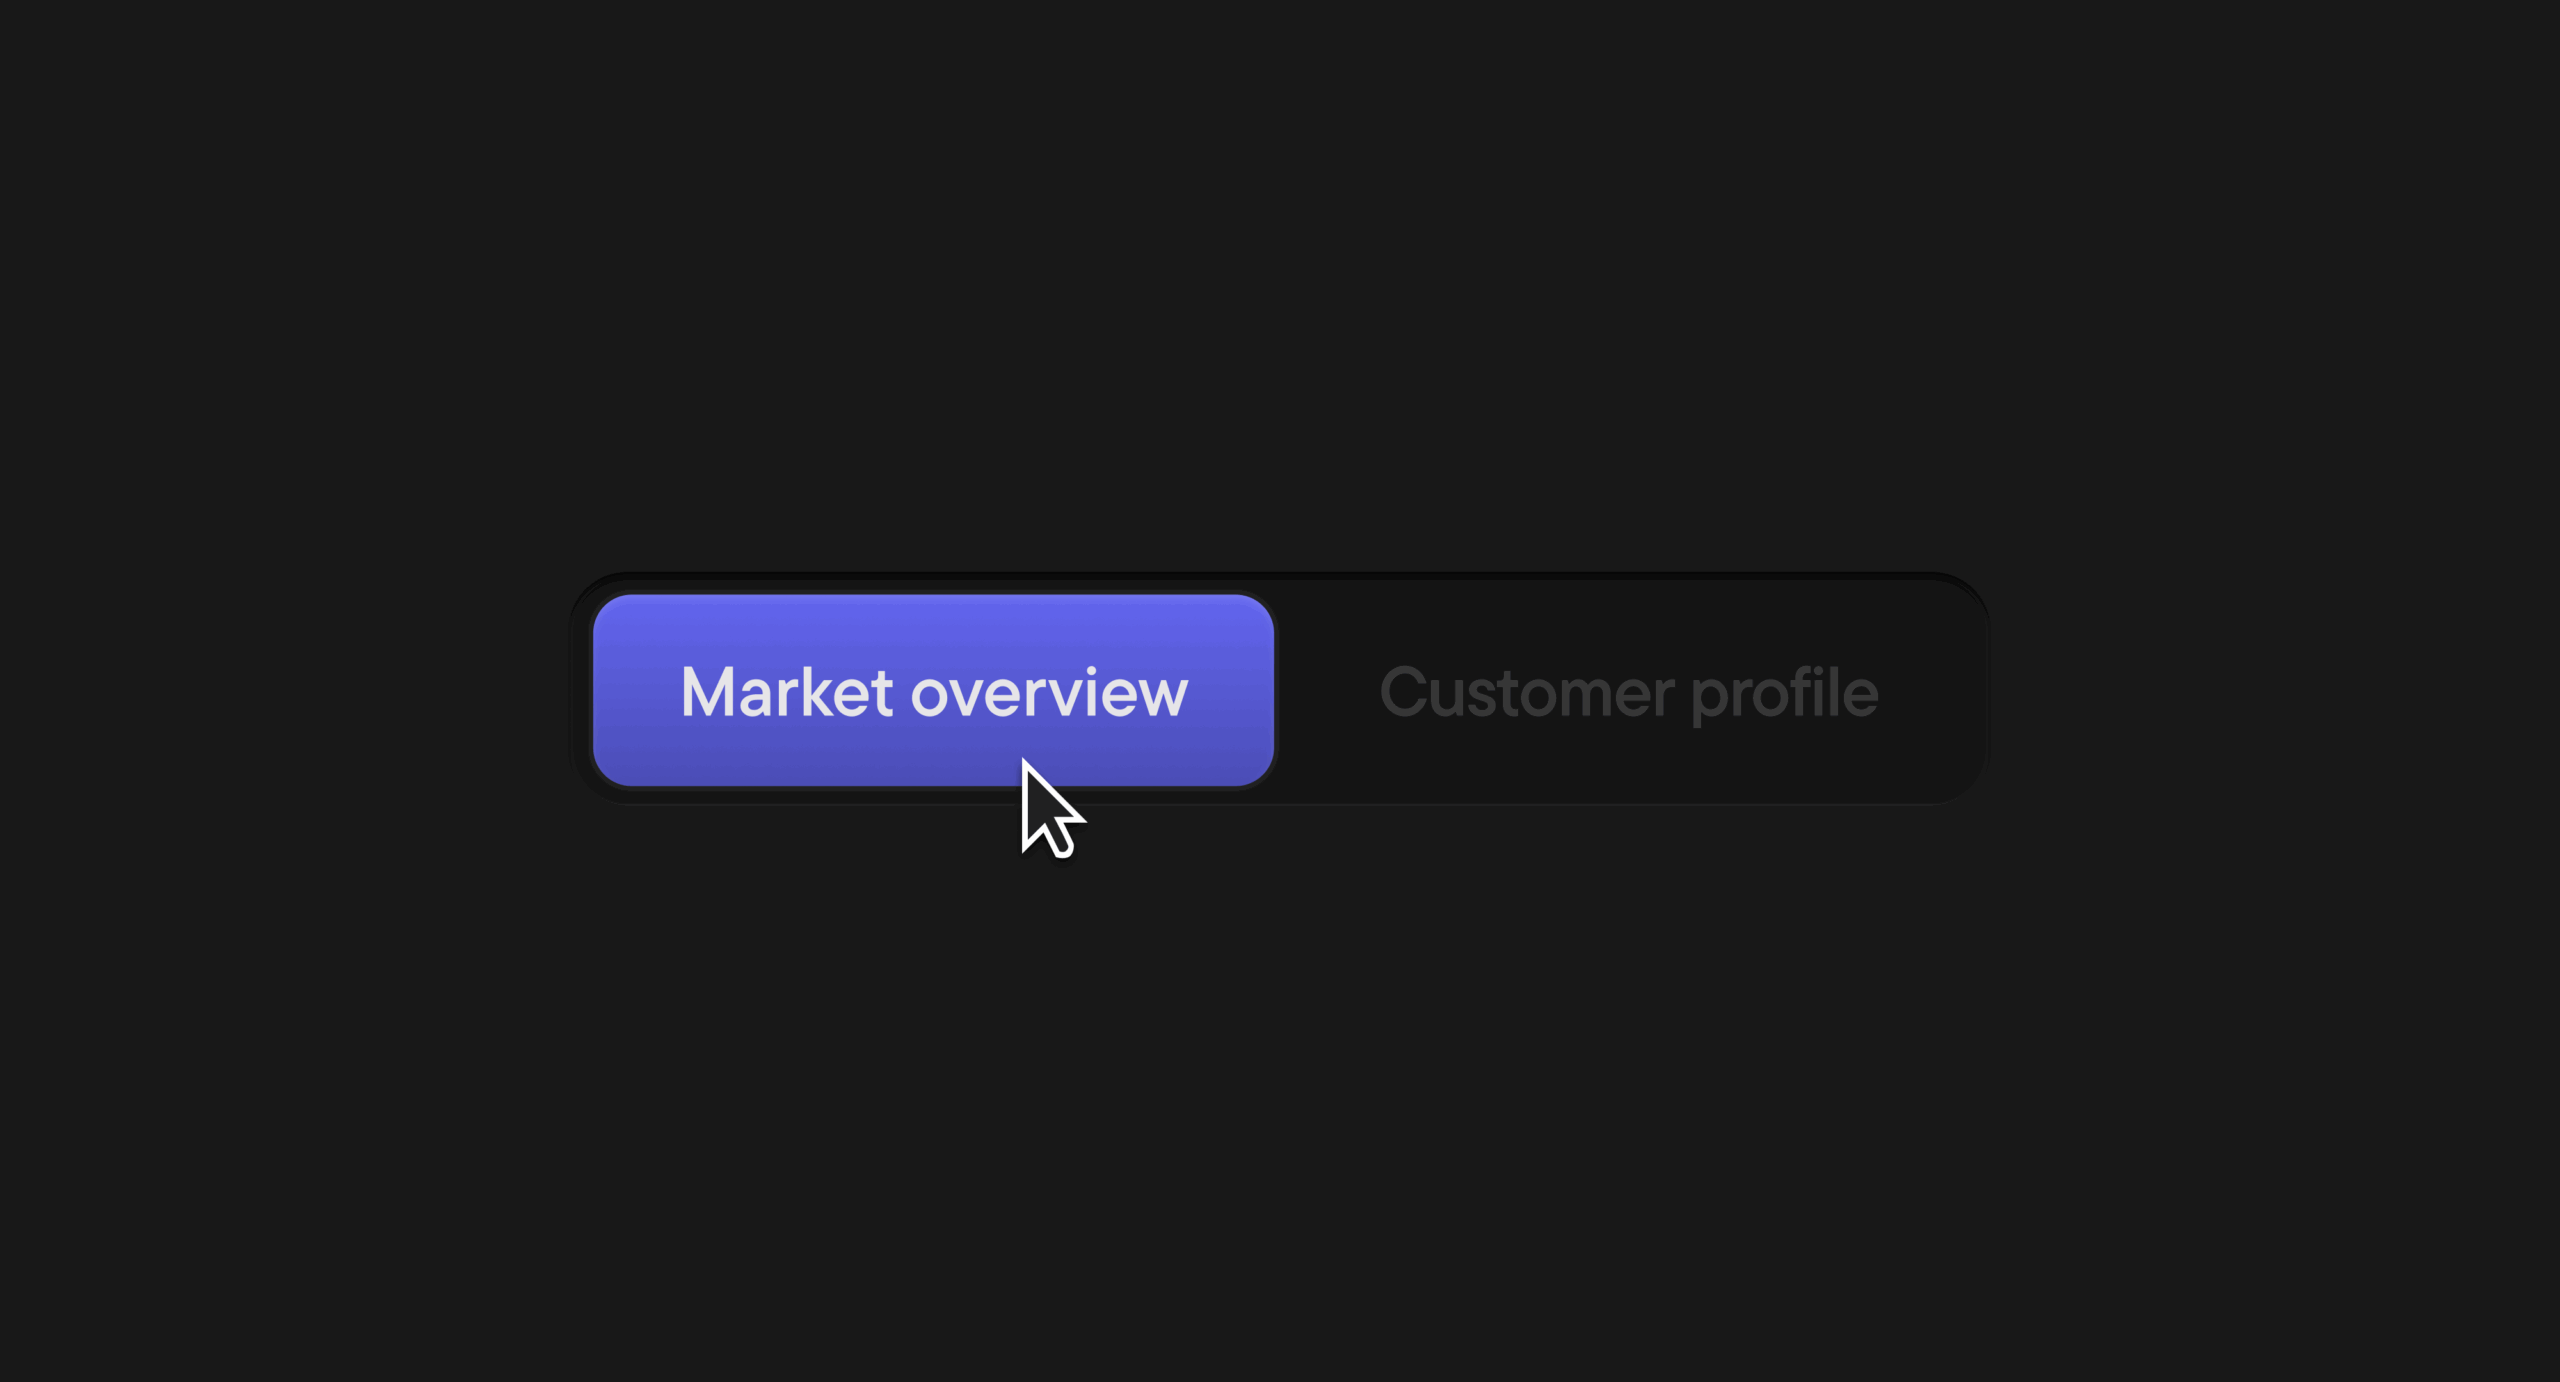
The chart can be toggled between two views:
- Market Mode — the aggregate Blask Index for all brands in the country, showing the overall volume of player interest over time.
- Compared Mode — individual brand lines plotted simultaneously, revealing which operators are capturing interest and which are losing ground to the market’s direction.
Blask Trends: stripping out the noise
Day-to-day, the Blask Index is volatile. Finals weekends, seasonal spikes, marketing surges — all of this creates movement that can obscure the underlying direction of a market.
Blask Trends is the layer that handles that problem. It smooths the raw index data and classifies the current market state into one of three categories:
- Growth — sustained upward momentum
- Stagnation — flat or sideways movement
- Decline — consistent downward pressure
The classification toggles directly on the Blask Index widget. Average and median values for the selected period remain visible alongside the trend line, providing a stable benchmark against which any given spike or dip can be evaluated.
For operators deciding when to increase media spend, or affiliates deciding when to rotate a market into their primary focus, the trend state is the first thing worth reading.
Market Explanation: what’s driving the trend
Knowing that a market is in growth is useful. Knowing why is what separates an analyst from a dashboard reader.
Market Explanation, launched in January 2026, addresses that gap directly. It is an AI-powered analytical layer built into the Blask Index chart. Click any segment of the trend line — growth, stagnation, or decline — and the system returns a structured brief explaining the forces behind that movement.
The engine conducts automated research across six categories of market drivers: the sports calendar, regulatory developments, payment infrastructure shifts, operator activity, macroeconomic conditions, and seasonality. It filters for high-impact events only. Every claim carries a numbered, linked source. No speculation, no unattributed summaries.
The output has a fixed structure:
- Overview — a diagnostic of the trend’s primary causes, in two sentences.
- Drivers — categorized by type: sports, regulation, payments, operators, macro, seasonality.
- Key events — specific dates, policy announcements, tournament windows, operator launches.
- Sources — numbered citations linking to original reporting.
Explanations regenerate four times daily and update whenever the underlying trend segment shifts. The practical effect: entering a market for due diligence no longer requires weeks of research or a local consultant.
Three consecutive trend explanations tell you the market’s recent regulatory history, its seasonal rhythms, and which operators shaped the period.
BAP: how brands stack up against each other
Blask Index shows the total volume of interest in a market. Brand’s Accumulated Power (BAP) — formerly Relative Market Share — shows how that volume is distributed among the brands competing for it.
BAP is constructed without reference to absolute numbers. The chart tracks percentage positions, not raw index values. That makes it especially useful alongside the Blask Index in Compared Mode: when the overall market is rising, BAP reveals which brands are holding their share of that growth and which are falling behind.
The two charts update on the same hourly cadence. Misalignments — a brand whose BAP is declining even as the market grows — are visible in real time.
APS and CEB: revenue and acquisition in range form
Acquisition Power Score (APS) estimate new users and Competitive Earning Baseline (CEB) complete the financial picture. These metrics were introduced in January 2025, replacing the earlier eFTD and eGGR designations.
Blask does not have access to operator financials. Instead, the platform draws on 56GB of regulatory reports, player surveys, and industry benchmarks to model what a brand should expect to generate, given its current Blask Index and market position.
Both metrics are expressed as ranges — a minimum, a maximum, and the most probable value — rather than single figures. That format is deliberate. It signals modeled estimates, not reported revenue.
How to read them:
If a brand’s actual performance falls within Blask’s calculated range, it is tracking at market-average efficiency. Below the range signals conversion or product problems. Above it is a meaningful indicator of outperformance relative to the market standard.
CEB covers a period, not a moment. It reflects what a brand could expect in the selected time window given its APS and the market’s retention benchmarks.
Seasonality: monthly peaks and weekly patterns
Below the financial metrics, the page offers two complementary views of how demand is distributed across time.
- The left panel — monthly ranking. Each bar represents the cumulative Blask Index for that calendar month across the selected year range. Taller bars are higher-demand months. Click any bar to see the exact Blask Index value and the month’s rank within the year. This view is useful for budget planning and campaign timing: recurring seasonal peaks show up as consistent spikes across years, separating structural seasonality from one-off events.
- The right panel — weekly heat map. A grid of day-of-week × hour (UTC) colored by demand intensity. The lightest cells are the hours of maximum interest; darker cells are low-activity windows. Click any cell to see the exact Blask Index value for that hour and day combination.
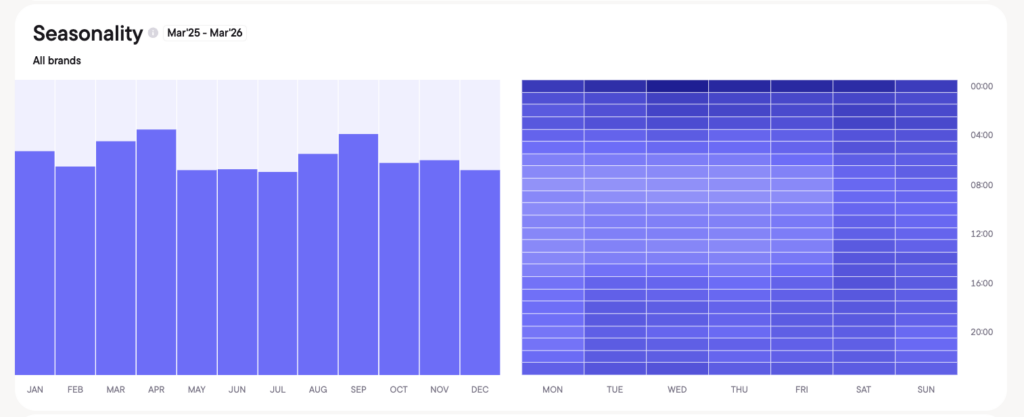
Together, the two panels answer different questions. The monthly ranking tells you which months to allocate spend toward. The weekly heat map tells you which hours within a week player interest is highest — relevant for campaign scheduling, bonus timing, and support staffing.
The brand table: three categories of operators
The brand table: three categories of operators
The bottom of the page carries a table of every brand tracked in that country. By default, brands sort by BAP — highest share first.
The table now distinguishes between three types of market presence:
- Onshore. The brand holds a local license and operates within the regulatory framework of the country. Its Blask Index, APS, and CEB reflect demand from resident players engaging with a licensed product.
- Offshore. The brand accepts players from this country but holds no local license. Offshore activity is tracked and measured with the same methodology as onshore — but the regulatory exposure is different, and so is the investment signal.
- Non-domestic. Blask records search interest for this brand originating from the country, but the brand either does not operate there or does not actively accept local players. The Blask Index for these brands reflects genuine, measurable demand. The APS and CEB show the potential that demand represents — not actual revenue generated. Brands in this category are marked and can be filtered out of aggregate market statistics.
The non-domestic category exists because ignoring large volumes of search interest would produce an incomplete picture of a market. A brand with 250 million in modeled CEB from non-domestic usage tells a regulator, an investor, and a competitor something real about latent demand in that geography.
Sorting the table
The table can be sorted by:
- BAP (market share position)
- APS (acquisition potential)
- CEB (revenue baseline)
- Year-over-year growth
- Month-over-month growth
- Date from which data is available
- Alphabetical order
Filters allow narrowing by minimum or maximum values on any numerical column, by casino vs. sports betting product type, and by desktop vs. mobile availability. Time-range filters applied to the page update the table alongside the charts.
Local vs. International: splitting the market by license status
In the period selector at the top of the page, there is a small chart icon. Clicking it switches the entire view into a Local / International split — separating brands that hold a local license in that country from brands operating without one.
When the split is active, two charts update simultaneously:
Blask Index divides into two separate lines and fills. The purple layer represents locally licensed brands; the orange layer represents international operators — those active in the market but not holding a local license. Watching how the two lines diverge over time shows whether regulatory pressure is shifting demand toward compliant operators, or whether offshore brands continue to capture a growing share of player interest despite licensing requirements.
Market Dynamics (APS and CEB) follow the same logic: both metrics split into two corridors, one per segment. This makes it possible to compare not just interest levels but estimated acquisition potential and revenue baseline across the two categories — a direct comparison of what the regulated segment delivers versus what operates outside the local framework.
The split is particularly informative in markets with active licensing regimes. A narrowing gap between local and international lines often precedes enforcement action or a structural shift in brand behavior.
Sub-national coverage: states, provinces, territories
As of March 2026, the Market Overview extends below the country level for three markets:
- United States — all 50 states
- Canada — all provinces and territories
- Australia — all states and territories
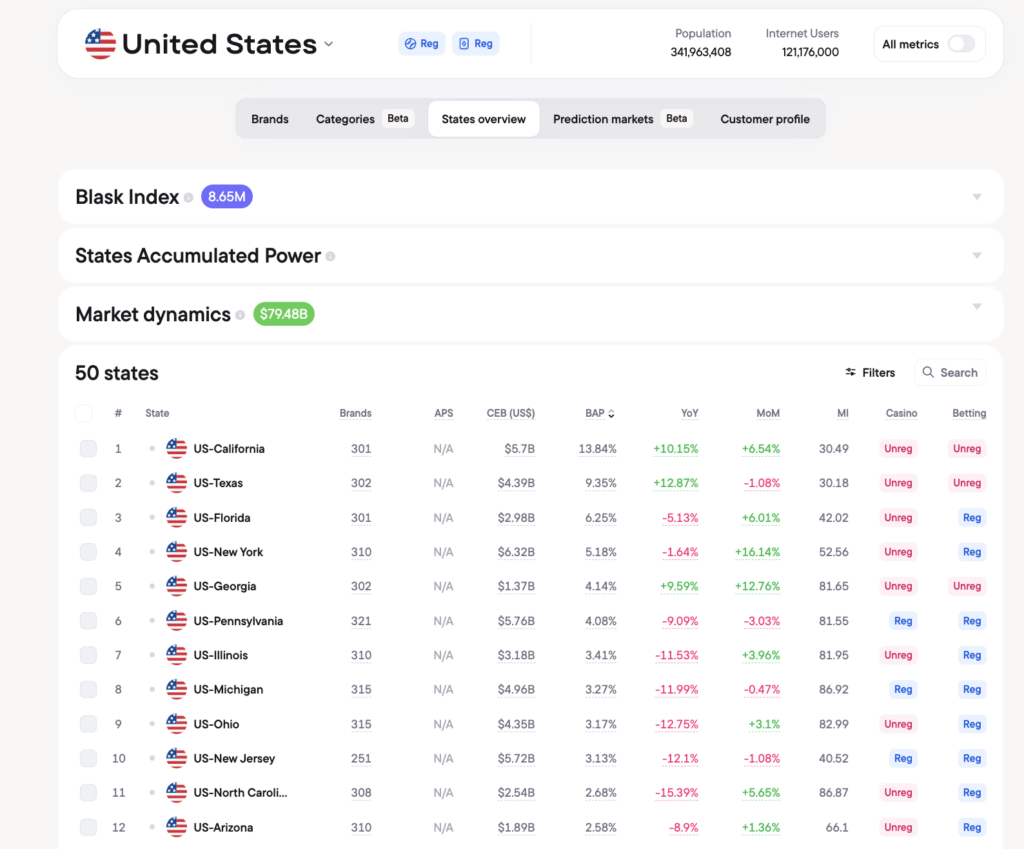
Each sub-national unit carries its own full Market Overview dashboard: Blask Index, BAP, APS, CEB, regulation status, and brand table. The data is collected and modeled at the state level, not disaggregated from national figures.
For operators active in multi-jurisdictional markets — particularly the United States, where each state is a distinct regulatory environment — this resolves a fundamental problem. A national Blask Index for the U.S. is useful context. A state-level view of New Jersey vs. Michigan vs. Pennsylvania is what actually informs budget allocation.
Time range and granularity
The date filter applies to every element on the page simultaneously: charts, tables, and summary metrics all reconfigure to the selected window. Historical data goes back to the date Blask first tracked a market, with hourly granularity for any period.
That granularity is not incidental. It enables a specific kind of analysis: isolating the effect of a single event. A major sponsorship announcement, a regulatory ruling, a payment method launch — the Blask Index in hourly view shows the inflection point precisely. The Market Explanation engine can then contextualize it.
How to use the Brand’s page in practice
The Country Overview is useful for several distinct workflows:
- Market entry assessment. Open a target country. Read the regulation status and the three most recent Market Explanations. Check the trend state. Review the top ten brands by BAP and CEB. In under fifteen minutes, you have a working model of the market’s current dynamics, the forces driving them, and the competitive landscape.
- Competitive monitoring. Add a competitor brand to the Blask Index chart in Compared Mode. Watch whether their BAP tracks the market’s direction or diverges from it. Set a recurring time range — weekly, monthly — to measure momentum.
- Campaign timing. Use Blask Trends to identify the current market state. Combine with the Market Explanation to understand whether a growth trend is event-driven (the World Cup) or structural (regulatory expansion). Event-driven growth ends; structural growth compounds.
- Board reporting. Each Market Explanation arrives pre-cited. The source list is ready for annexes and investment memos without additional research overhead.