

- Updated:
- Published:
How to calculate true CAC in iGaming: build the numerator, track when it loads, diagnose high CAC

On a 1 000-FTD UK casino cohort, the performance dashboard shows £228 per qualified depositor — media plus affiliate CPA in the numerator only. Add welcome promo, payment fees, sponsorship share, and safer-gambling allocation on public UK ratios, and true CAC rises to about £454. LTV:CAC moves from 3.9:1 on headline CPA to 1.9:1 on the fully loaded numerator — enough to pass vs fail a typical payback gate.
The CAC my market article maps acquisition bands by GEO, channel, and organic rank. This piece covers three jobs:
- How to build the true CAC numerator.
- When additional lines load onto it (D0 / D7 / D30)
- Where to look if CAC still looks high — media cost, pre-deposit funnel, or monetisation.
| ❗️ Blask does not publish proprietary CAC. Public disclosures and the formula below build the numerator; APS and CEB run the high-CAC diagnosis. |
True CAC vs blended vs paid vs affiliate CPA
Most planning decks already separate three acquisition metrics. Keep them apart — then add a fourth:
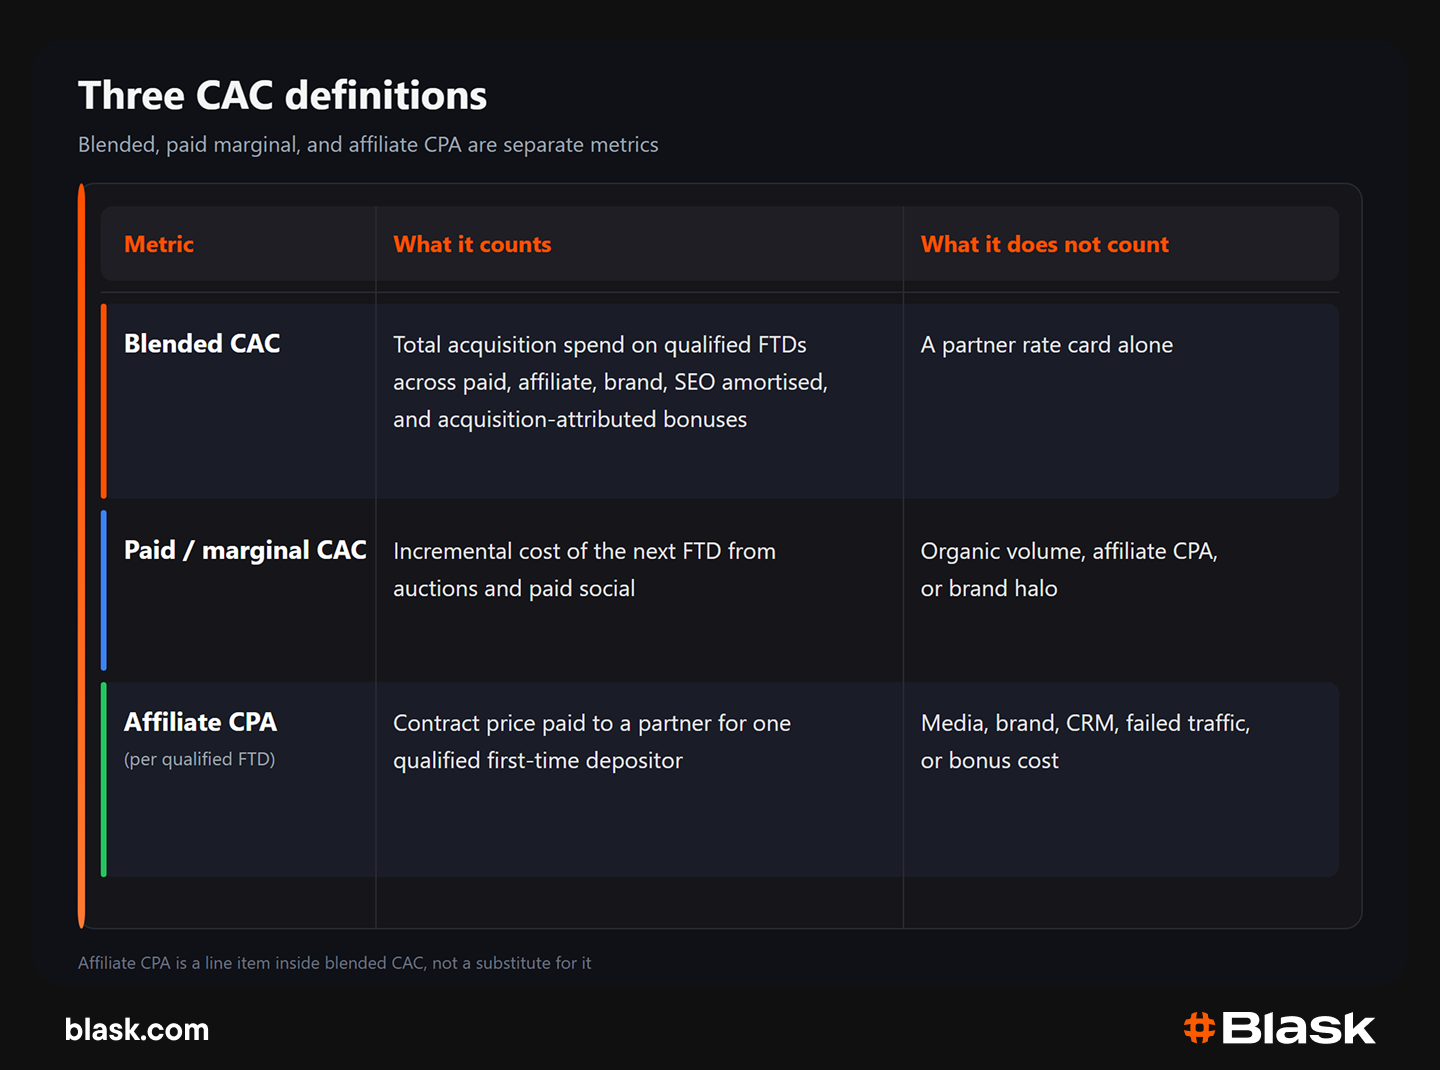
Blended CAC, paid / marginal CAC, and affiliate CPA are defined in the market bands piece. True CAC is the fourth metric: the fully loaded cost to create one qualified first-time depositor, with every acquisition-attributed line in the numerator and mis-tagged reactivations credited out.
| ❗️ Affiliate CPA is a line inside true CAC, not a substitute. Paid CAC is a marginal bid signal, not what finance paid to own the FTD. |
How to build the true CAC numerator
This is the true CAC formula:
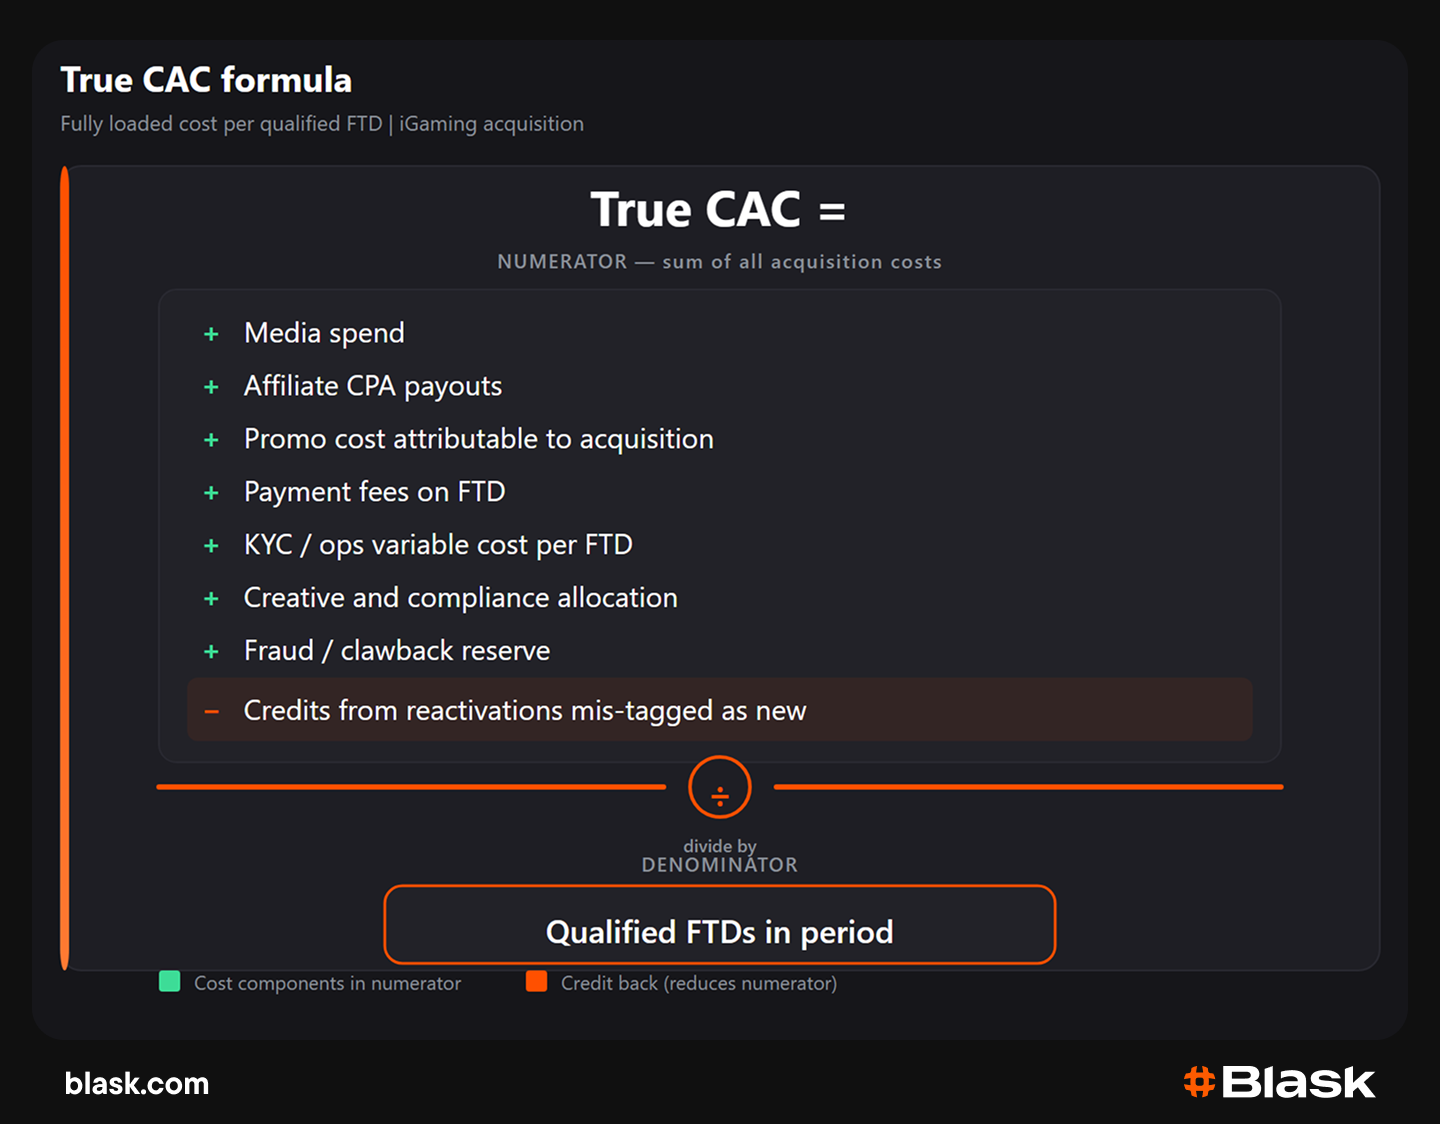
Flutter’s FY2024 filings count customer acquisition cost as marketing plus promotional spend — not media or affiliate invoices alone. Entain’s FY2024 UK&I segment carried £226m of marketing on £2.05bn NGR (~11%). Those ratios belong in the numerator when the welcome offer is the conversion lever.
Component table (calibrate to your ledger; magnitudes from public UK/EU disclosures):
| Component | Include | Typical magnitude | Often forgotten because |
| Paid media | Auctions, paid social, programmatic, non-brand search | BGC members spent £768m on digital ads (Oct 2023–Sep 2024) | Treated as the whole numerator |
| Affiliate CPA | Qualified-FTD payouts, overrides, hybrid true-ups | Post-RGD, Rank protected performance marketing while cutting above-the-line spend | Mistaken for full CAC |
| Acquisition promos | Welcome bonus / free bet on FTD cohort | H2 UK online iGaming bonusing ~16.8% of GGR | Booked in “promo”, not “acquisition” |
| Payment fees (FTD) | Deposit processing, FX, failed-retry handling | ~10–15% of NGR in BGC/PwC P&L templates | Quoted MDR ≠ all-in cost |
| KYC / ops variable | Document review, escalation, geo verification | UKGC holds operators responsible for affiliate compliance | Booked in fixed overhead, not in UA numerator |
| Creative + compliance | Local assets, RG messaging, legal review | ~20% of BGC member advertising to safer gambling | Amortised quarterly, not per cohort |
| Sponsorship / brand | Naming rights, perimeter, broadcast (acquisition share) | £138m sponsorship in the same BGC ad report | Booked outside the UA dashboard |
| Fraud / clawback reserve | Bonus abuse, multi-account, chargeback-prone traffic | Hits post-period on acquisition-attributed promo | Absent until month two |
| Branded PPC adjustment | Brand search that mostly re-acquires existing users | Split brand vs non-brand before scaling | Last-click counts as “new” |
| Mis-tagged reactivations | CRM win-back coded as FTD | Credit back to true CAC | Inflates denominators |
Top three lines by £ impact (UK casino)
- Welcome / FTD promo — usually the largest line missing from headline CAC in regulated casino markets; H2 treats bonusing as a direct GGR input.
- Payment + platform on first cash-in — headline MDR is not all-in. Declines and retries sit outside the media dashboard.
- Branded PPC and mis-tagged new — returning players assigned to paid new inflate both CAC and false ROAS.
Four more gaps show up when finance and UA disagree on definitions. The same FTD can trigger both affiliate CPA and media spend when attribution overlaps — pick one path. Creative and compliance sit per licence market, not as one global line. App install and deposit often fall in different months; cross-sell promos counted against sports CAC when the player already exists on sportsbook are CRM, not acquisition.
Worked example 1: UK online casino (FY 2024–25)
Method: 1 000 qualified FTDs; £600 000 cohort GGR in the first 90 days (£600 GGR per FTD). Lines apply public UK ratios — not Blask CAC data.
| Cost line | Reported CAC | True CAC | Source basis |
| Paid media + affiliate CPA | £228 000 | £228 000 | Rank protected performance UA post-RGD |
| Welcome / FTD promo | — | £101 000 | H2 16.8% × £600k GGR |
| Payment + platform on FTD | — | £52 000 | BGC/PwC template: ~10% of NGR (NGR ≈ £516k after bonusing) |
| Sponsorship share (acquisition) | — | £27 000 | BGC £138m ÷ £1.15bn ads × £228k UA |
| Safer-gambling / compliance messaging | — | £46 000 | BGC ~20% of gambling advertising |
| Total | £228 000 | £454 000 | |
| Per FTD | £228 | £454 |
Assume Net LTV £890 on the same cohort. Bonuses and payment already in the LTV model — not double-counted here.
| Payback | Reported CAC | True CAC |
| LTV:CAC | 3.9:1 | 1.9:1 |
| Verdict | Passes typical payback gate on headline CPA | Fails payback gate — fix numerator before scale |
BGC licensed advertising alone implies ~£34 per new registration (£1.15bn ÷ 34.0m registrations) — before bonuses and the lines above.
When the numerator loads: D0, D7, D30
The numerator loads over time — not in one UA export. A single CAC snapshot leaves out lines that post on D7 and D30.
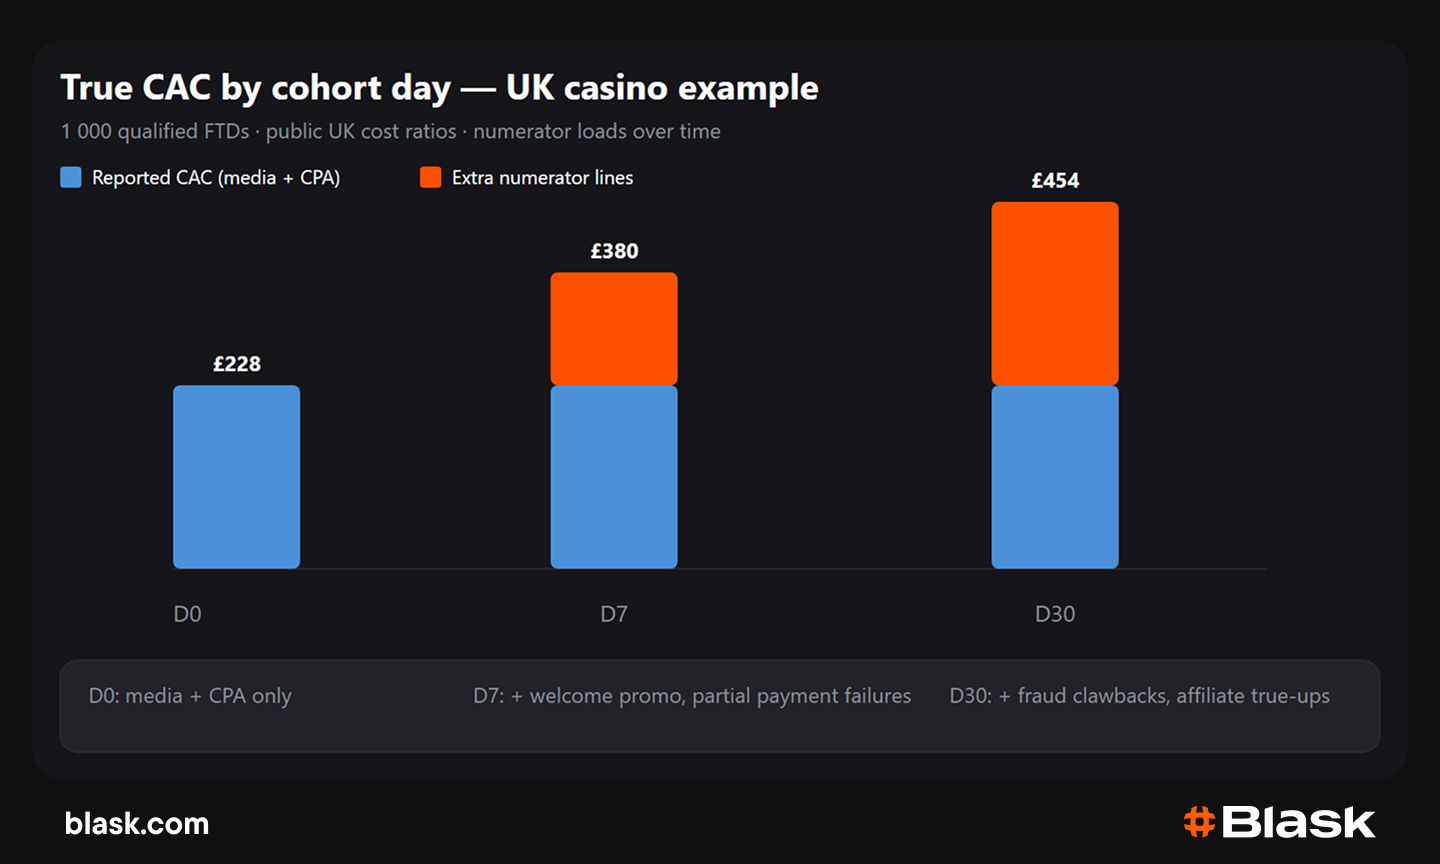
Report D0, D7, and D30 true CAC on every scale decision. Finance and UA should sign which promo accrual rule marks the FTD cohort as acquired (commonly D7 activity or second deposit).
True CAC by channel: same GEO, different numerator lines
Headline CPA or CPC is channel-specific. The extra numerator lines that load after invoice differ by channel too.
| Channel | Headline cost | Numerator lines that load later | True CAC vs headline |
| Affiliate CPA | Per-FTD partner invoice | Bonus abuse, double attribution, partner compliance, hybrid true-ups | Highest gap |
| Paid social / auction | CPC / CPM in platform | FTD promo, payment failures; less fraud than incentive-led CPA | Mid |
| Sponsorship / brand (acq. share) | Often outside UA dashboard | Finance allocation rule; harder to tie to one FTD cohort | Lowest allocated — attribution debate |
Illustrative UK split on the same GEO:
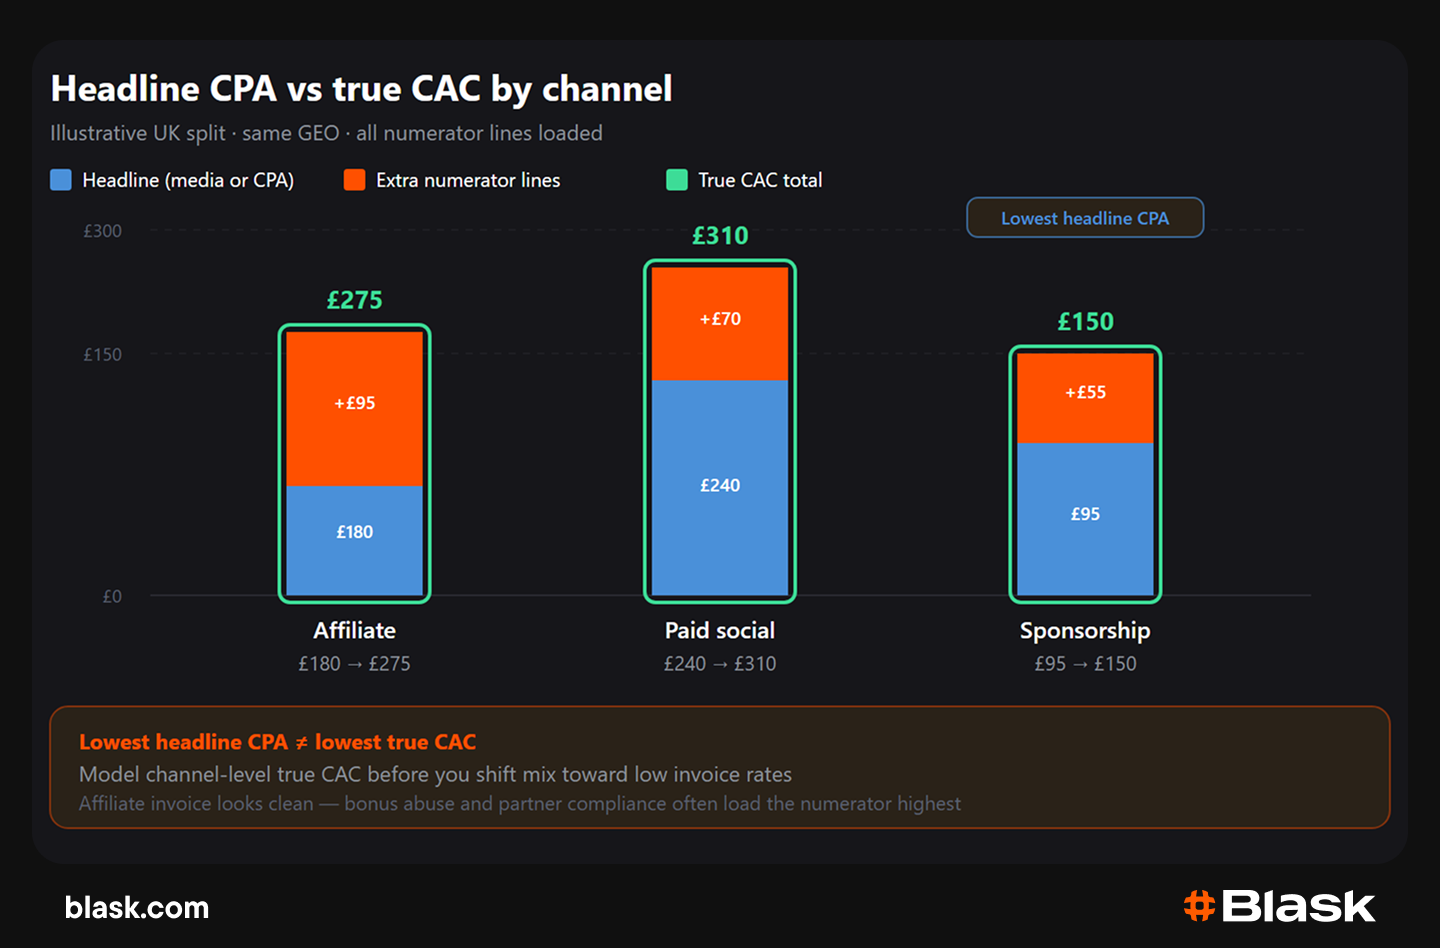
The lowest headline CPA is not the lowest true CAC. Model channel-level true CAC before you shift mix toward low invoice rates.
Worked example 2: Brazil, affiliate-heavy sportsbook mix
Method: 1 000 qualified FTDs; $400 000 cohort GGR in 90 days ($400 GGR per FTD — sports-led, thinner than UK casino). Brazil’s category demand is ~56% online betting vs ~7.8% online casino + live (Blask Categories, L1, July 2026) — promo intensity and CPA mix differ from the UK casino row above.
| Cost line | Reported CAC | True CAC | Source basis |
| Paid media + affiliate CPA | $165 000 | $165 000 | Affiliate-heavy land-grab; performance UA dominant |
| Welcome / FTD promo | — | $28 000 | Lower sports bonus intensity vs UK casino (~7% × $400k GGR — calibrate to ledger) |
| Payment + platform on FTD | — | $34 000 | BGC/PwC template: ~10% of NGR |
| Affiliate compliance / partner liability | — | $18 000 | SPA chain: operators liable for affiliate publicity |
| Fraud / clawback reserve (CPA traffic) | — | $12 000 | Bonus-arbitrage rings on incentive-led partners |
| Total | $165 000 | $257 000 | |
| Per FTD | $165 | $257 |
Nominal headline CPA can look lower in USD than UK Tier-1 — true CAC still rises ~56% when affiliate liability and fraud reserves enter the numerator. Bands and true CAC answer different questions: Brazil can show a low partner rate card and still fail payback once the full numerator is built.
Category mix: which numerator lines weigh most
Blask category demand shows how promo vs affiliate vs compliance lines shift weight by GEO:
| Market | Online Betting share | Online Casino + Live share | Numerator read |
| Brazil | 56.3% | 7.8% | Affiliate CPA + partner compliance |
| UK | 9.6% | 19.9% | Welcome promo + safer-gambling allocation |
| Germany | 3.1% | 39.7% | Casino promo + restricted-media compliance |
Same true CAC formula, but different row weights.
Where to look if CAC looks high
True CAC can be on plan while payback still fails. After you build the numerator and check LTV:CAC, use Blask APS (Acquisition Power Score: expected new-customer potential from search demand, min / avg / max) and CEB (Competitive Earning Baseline: projected revenue baseline at current market position, min / avg / max) to see what to fix next. CEB is not operator P&L — it is the revenue corridor demand should support at current position.
Same APS, very different CEB — look at monetisation, not media cost
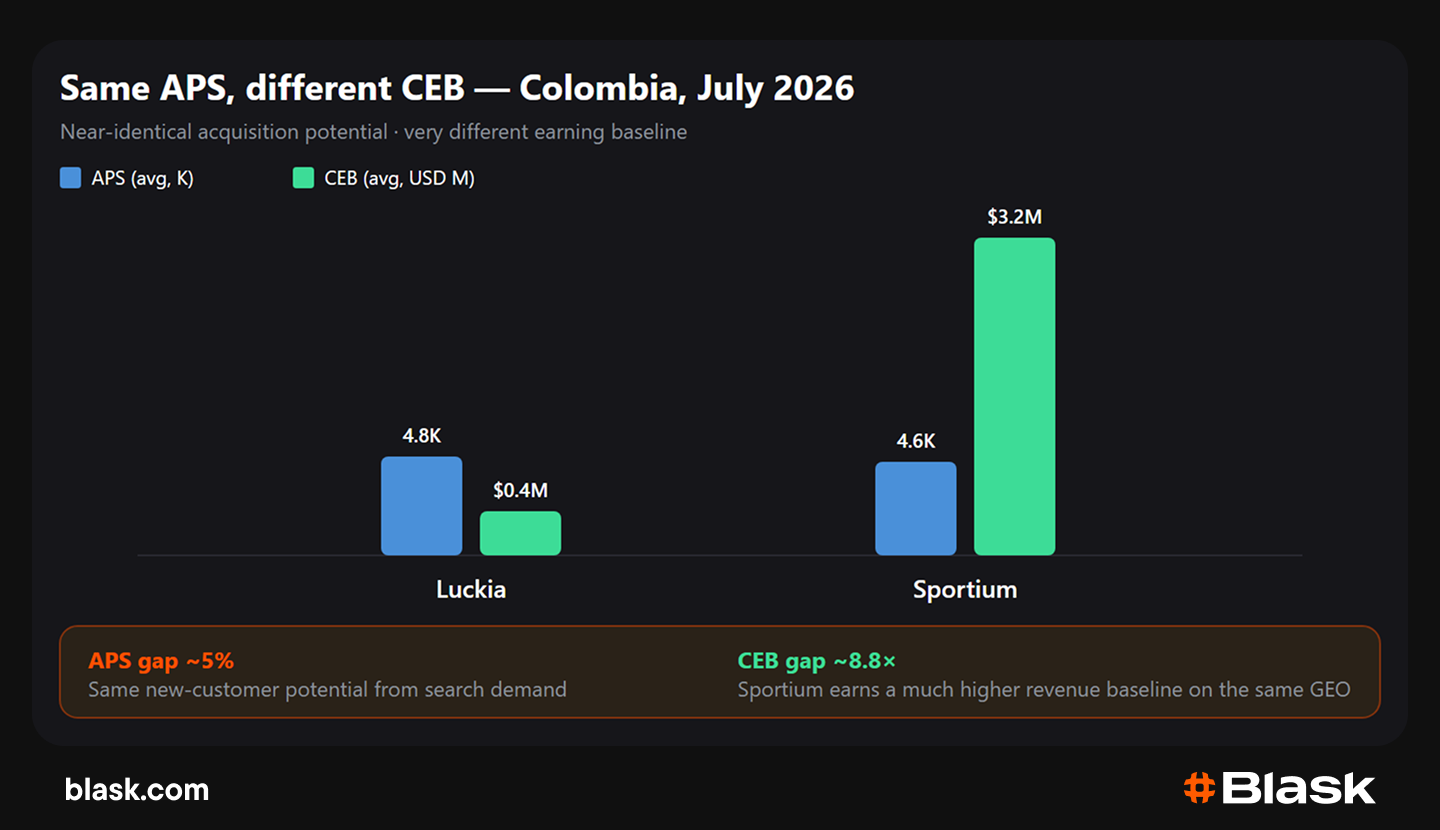
APS gap ~5%. CEB ratio ~8.8×. If Luckia’s paid CAC looks high against Sportium’s CPA benchmark, check product mix, promo efficiency, payment conversion, and CRM before you cut media or affiliate rates.
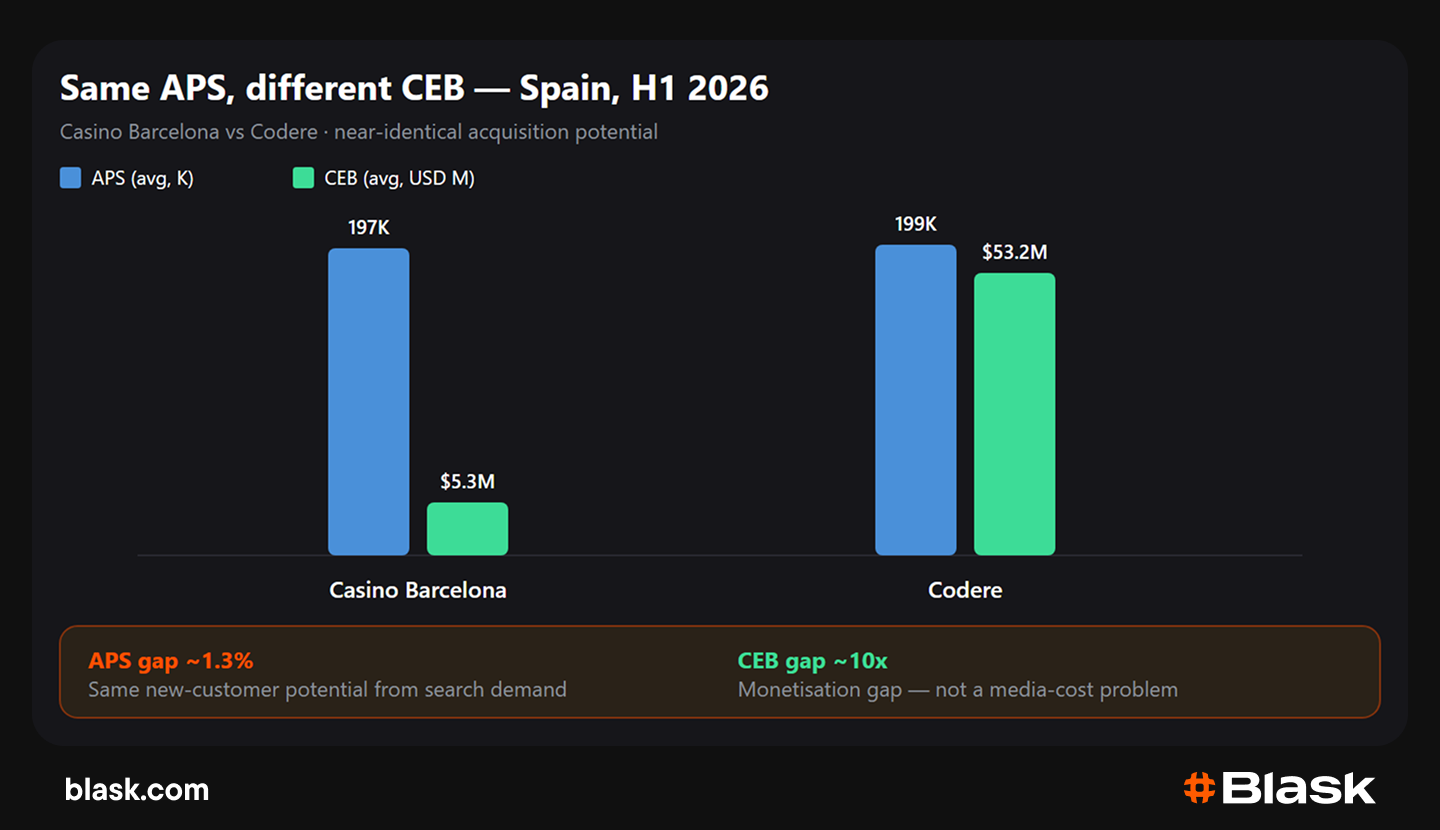
Same pattern in a mature regulated EU market: near-identical APS, CEB an order of magnitude apart. If CEB sits far below peers at similar APS, more spend adds FTDs into a base that under-earns — fix monetisation before you scale paid.
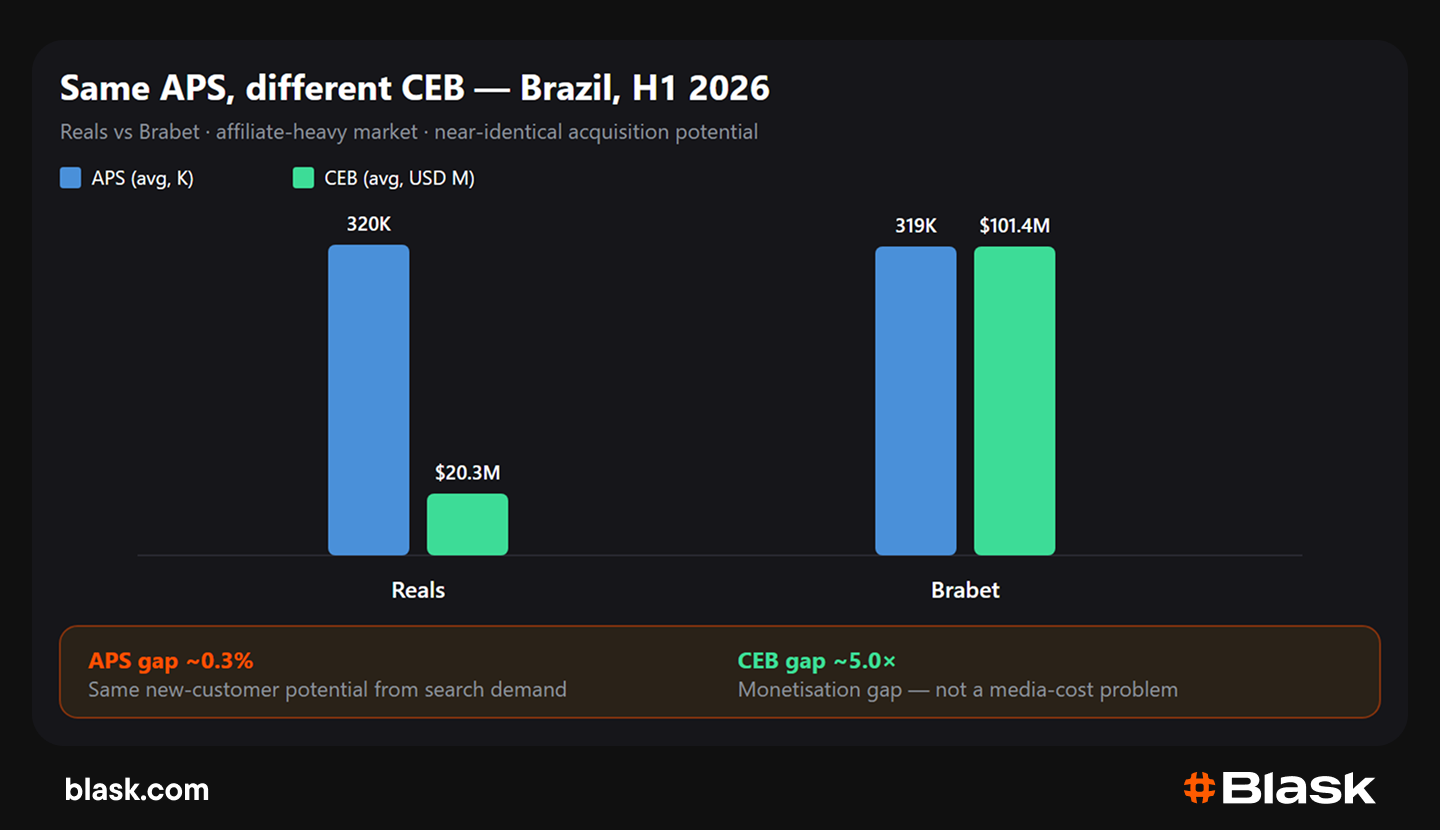
The pattern holds in Brazil too: near-identical APS (~0.3% gap), CEB ~5x apart. In an affiliate-heavy GEO, a clean partner invoice is not a payback signal — fix monetisation before you optimise the numerator.
Similar CEB, APS diverges — look at the acquisition funnel
When peers sit in the same CEB band but APS diverges by 25%+, check visibility and pre-deposit conversion — KYC drop-off, weak brand search, install-to-deposit lag — before you cut promo or renegotiate CPA.
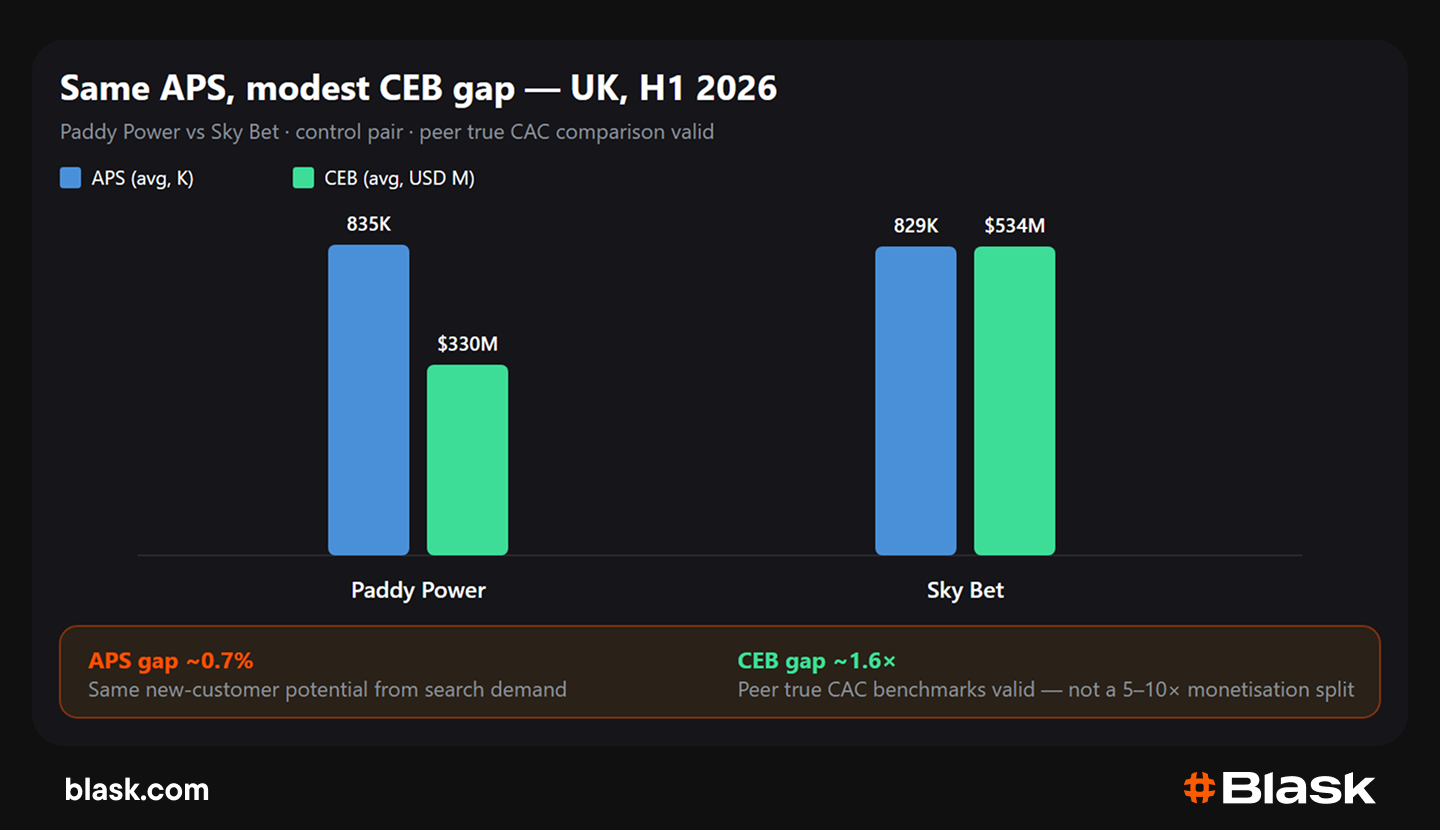
Paddy Power and Sky Bet sit in the same APS band (~0.7% apart) with a ~1.6x CEB spread — not the 5–10x split seen in Colombia, Spain, or Brazil. That makes this a valid peer pair for true CAC: if one brand’s fully loaded cost looks high against the other, the read is likely acquisition efficiency or numerator build, not a broken monetisation base. Use pairs like this as the control before you benchmark against brands in a different CEB league.
When APS diverges at similar CEB, the problem usually sits upstream of monetisation. Qualified FTDs may sit below the APS Worse band while branded PPC still counts returning players as paid new. Mis-tagged reactivations inflate the denominator; spend booked in one month and FTDs credited in another split the numerator across periods.
Operating rules
- Four metrics, one owner. Blended CAC, paid marginal CAC, affiliate CPA, and true CAC — finance and UA sign definitions. No deck uses affiliate CPA as proxy for true CAC.
- D0 / D7 / D30 on every scale decision. Track when numerator lines load (see table above).
- Channel-level true CAC in the mix model. Compare channels on full numerator, not headline CPA.
- Split sportsbook and casino rows before merging GEO totals. Category mix changes which numerator lines weigh most.
- Rebuild the numerator when the rulebook moves. Tax, ad restrictions, and bonus policy add or remove lines faster than creative tests — treat as a restatement event, not a performance blip.
Bottom line
True CAC in iGaming is the full numerator per qualified FTD — promos, payments, ops, compliance, fraud reserves, and attribution corrections. Skip a line and LTV:CAC uses the wrong cost base; channel mix optimises headline CPA instead of true CAC.
Bands set market acquisition pressure. This formula shows how to build the numerator and when it loads. APS and CEB show where to look if CAC still looks high.
Book a Blask demo — map your true CAC against peer APS and CEB before you cut spend or shift channel mix.