- Updated:
- Published:
Average Revenue Per User (ARPU)
Average Revenue Per User (ARPU) measures how much revenue an iGaming operator generates per user over a defined period. It connects two numbers every casino and sportsbook tracks: revenue and the size of its user base.
But the number can be misleading on its own. Revenue can grow while ARPU falls. A campaign attracting lower-value players can outperform one bringing in higher-value customers if acquisition costs fall faster. And an operator reporting impressive ARPU may still struggle with retention or profitability.
ARPU is therefore most useful as a diagnostic metric. It helps explain where growth comes from, how acquisition affects player economics, and whether revenue is keeping pace with the audience.
What is Average Revenue Per User (ARPU)?
ARPU stands for Average Revenue Per User. It divides the revenue generated during a reporting period by the number of users included in that period.
In iGaming, the metric is commonly used to assess monetization across an online casino or sportsbook’s active player base. Unlike Average Revenue Per Paying User (ARPPU), it includes users who generate no revenue during the period, provided they meet the chosen user definition.
This makes ARPU sensitive to both paying-player behavior and the proportion of the audience that actually pays. A brand attracting thousands of new active users can see ARPU decline even as revenue increases.
Who counts as a user?
The denominator is one of the most important decisions in an ARPU calculation.
Operators typically use monthly active users (MAU) for monthly reporting, but some businesses calculate revenue per registered account or within a defined acquisition cohort. These approaches produce different results.
Consider a casino with 100,000 registered accounts, 20,000 monthly active users, and 5,000 depositors. Dividing the same revenue by each group would produce three different averages.
For meaningful comparisons, the definition must remain consistent. Operators should also specify whether an active user is someone who logged in, placed a real-money bet, or completed another qualifying activity.
How to calculate ARPU in iGaming
The basic ARPU formula is:
ARPU = Revenue during the period ÷ Number of users during the same period
For an online casino using net gaming revenue and monthly active users:
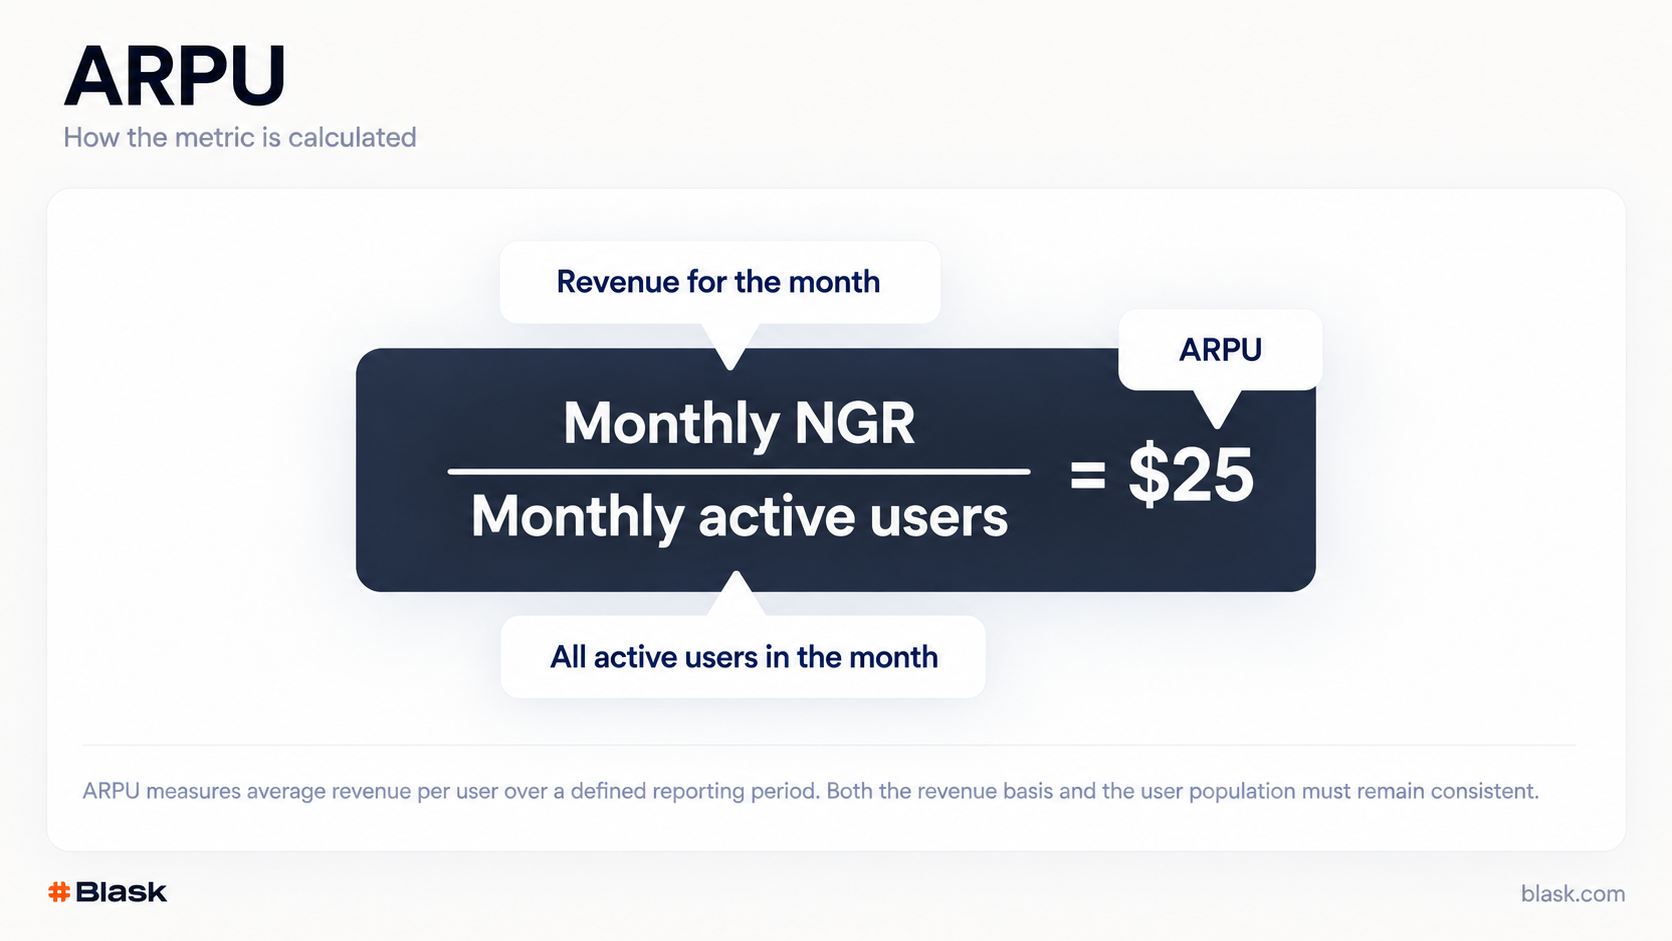
Monthly ARPU = Monthly NGR ÷ Monthly Active Users
Step-by-step ARPU calculation
Suppose an operator reports the following hypothetical results for one month.
| Metric | Monthly value |
|---|---|
| Registered users | 50,000 |
| Monthly active users | 20,000 |
| Unique paying users | 5,000 |
| Gross Gaming Revenue | $650,000 |
| Net Gaming Revenue | $500,000 |
Using NGR as the revenue base:
ARPU = $500,000 ÷ 20,000 = $25
The casino generated $25 in net gaming revenue per monthly active user.
That does not mean every user deposited or lost $25. Most revenue may have come from a relatively small group of players, while other active users generated little or no revenue.
Using GGR instead would produce $32.50. Both figures can be useful, but they should never be combined in one time series without clearly identifying the change in methodology.
Daily, monthly, and quarterly ARPU
Monthly ARPU is often the most practical measure for operator reporting, but shorter periods can help investigate campaign results, product launches, and sporting events.
Daily ARPU is more volatile because revenue and activity can change sharply around particular events. Quarterly ARPU offers a broader view, although it can conceal short-term shifts in player behavior.
One common mistake is averaging three monthly ARPU figures and calling the result quarterly ARPU. The same user may appear in multiple months. A true quarterly calculation requires quarterly revenue divided by the defined quarterly user population.
GGR vs NGR: What revenue should ARPU use?
Revenue is not the same as the money players deposit or wager.
Gross Gaming Revenue (GGR) is generally calculated as stakes minus winnings, subject to the operator’s accounting methodology. Net Gaming Revenue (NGR) deducts additional items, which may include bonuses, gaming taxes, payment costs, and other agreed adjustments.
There is no universal NGR deduction list. Two operators using the same label can report different figures depending on what is included.
- For commercial analysis, NGR-based ARPU can provide a more relevant view of monetization after defined deductions.
- GGR-based ARPU is useful for understanding gaming results before those deductions.
An operator should identify which measure it uses and apply it consistently.
Deposits should not replace either figure. A player depositing $200 may generate $20, $100, zero, or negative gaming revenue, depending on subsequent wagering outcomes.
Related reading: Gross Gaming Revenue (GGR) and Net Gaming Revenue (NGR).
ARPU vs ARPPU: Two different views of monetization
ARPU measures revenue across the entire defined user population. ARPPU focuses exclusively on paying users.
Using the previous casino example, $500,000 in NGR divided by 20,000 active users produces ARPU of $25. Dividing the same revenue by 5,000 paying users produces ARPPU of $100.
💡 Key point: The difference is not revenue. It is the denominator.
| ARPU | ARPPU | |
|---|---|---|
| Formula | Revenue / All defined users | Revenue / Paying users |
| Includes non-paying users | Yes | No |
| Main purpose | Overall audience monetization | Paying-player monetization |
| Sensitive to | Payer conversion and revenue per payer | Revenue per payer |
When both metrics use identical revenue, period, and user definitions, their relationship can be expressed as:
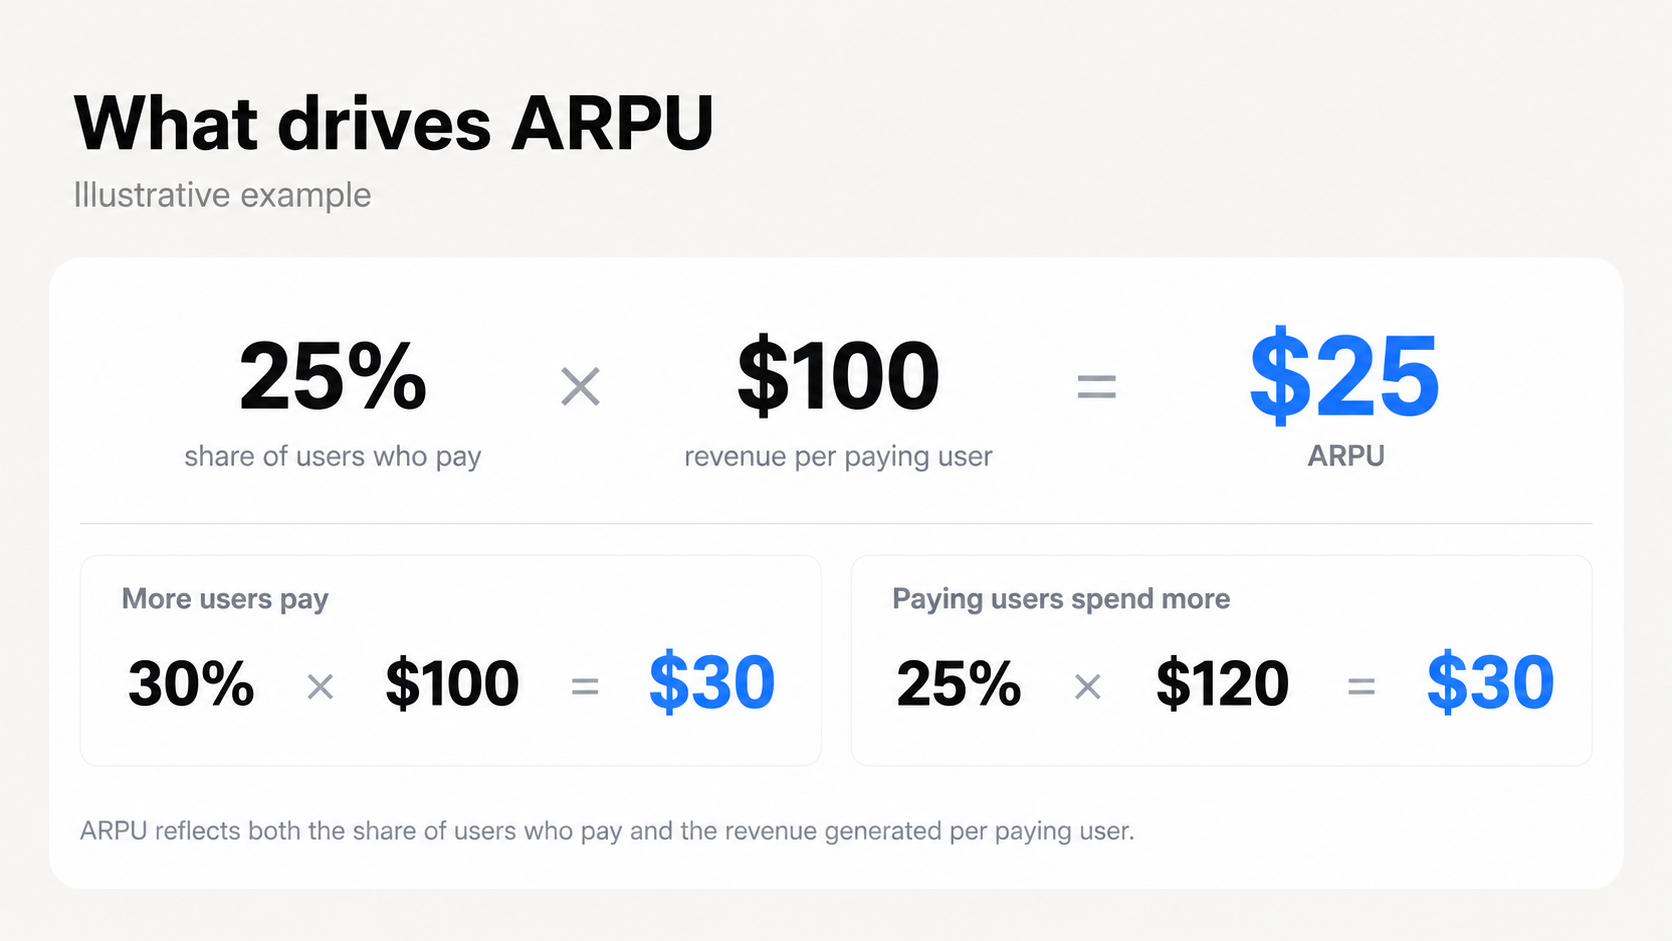
ARPU = Paying User Conversion Rate × ARPPU
If 25% of monthly active users are paying customers and ARPPU is $100, ARPU equals $25.
That relationship reveals two possible sources of ARPU growth: a higher proportion of users becoming payers, or more revenue per paying user. The two can also move in opposite directions.
For a closer look at the paying-player metric, see Average Revenue Per Paying User (ARPPU).
ARPU vs LTV, ARPDAU, and average deposit
ARPU describes revenue per user during a defined period. Other player economics metrics answer different questions.
- Lifetime Value (LTV) measures the cumulative or expected economic value of a customer over a longer relationship with the operator. A player generating $30 in monthly ARPU does not automatically have an LTV of $360 after a year: retention, activity, costs, and changing revenue patterns all matter.
- Average Revenue Per Daily Active User (ARPDAU) uses daily revenue and daily active users. It is useful for short-term performance monitoring but is not interchangeable with monthly ARPU.
- Average deposit measures payment behavior rather than gaming revenue. Higher deposits do not necessarily translate into higher ARPU, particularly when wagering outcomes or promotional costs change.
Together, these metrics help distinguish acquisition, activity, monetization, and long-term customer value.
What drives ARPU in online casinos and sportsbooks?
ARPU changes when revenue grows or declines relative to the chosen user population. Several forces can affect that relationship.
Paying-user conversion
A brand may attract substantial traffic and registrations without increasing revenue proportionally. If the number of active users grows faster than the number of depositors, ARPU can decline.
That does not automatically mean the traffic is poor quality. Newly acquired customers may convert later, and some acquisition channels may have materially lower costs.
Player retention
Retention affects how the user base evolves and how revenue accumulates across cohorts.
An operator that retains customers over several months may develop more predictable revenue than one continually replacing churned players. However, retention by itself is not enough to determine ARPU: retained customers must also be evaluated against actual revenue, costs, and responsible gambling indicators.
📚 Read more: Retention in iGaming breaks in the same 4 places
Casino and sportsbook product mix
Casino and sportsbook audiences do not necessarily monetize in the same way.
Casino revenue depends on game mix, wagering patterns, and actual player outcomes. Sportsbook revenue is also affected by event schedules, odds, trading performance, and sporting results.
A sportsbook-heavy brand can experience considerable revenue volatility around major tournaments, while a casino-heavy operator may exhibit a different activity profile.
Bonuses and acquisition costs
A campaign can raise GGR while reducing NGR if promotional deductions increase substantially. The effect on ARPU depends on both the resulting revenue and the size of the user population.
Acquisition costs sit outside ARPU itself, but they are crucial to deciding whether a particular level of ARPU is commercially sustainable.
💡 Key point: This leads to one of the most important distinctions in performance marketing: lower ARPU is not always worse.
Case study: BROFIST × Chicken Road — When lower ARPU makes commercial sense
Switzerland had been an important market for BROFIST, but the company reported that its established slots-focused traffic strategy was no longer delivering the required volumes.
Instead of continuing to compete for the same audience, the team tested a different game category: crash games. It selected Chicken Road from InOut Games and ran a campaign over approximately two weeks.
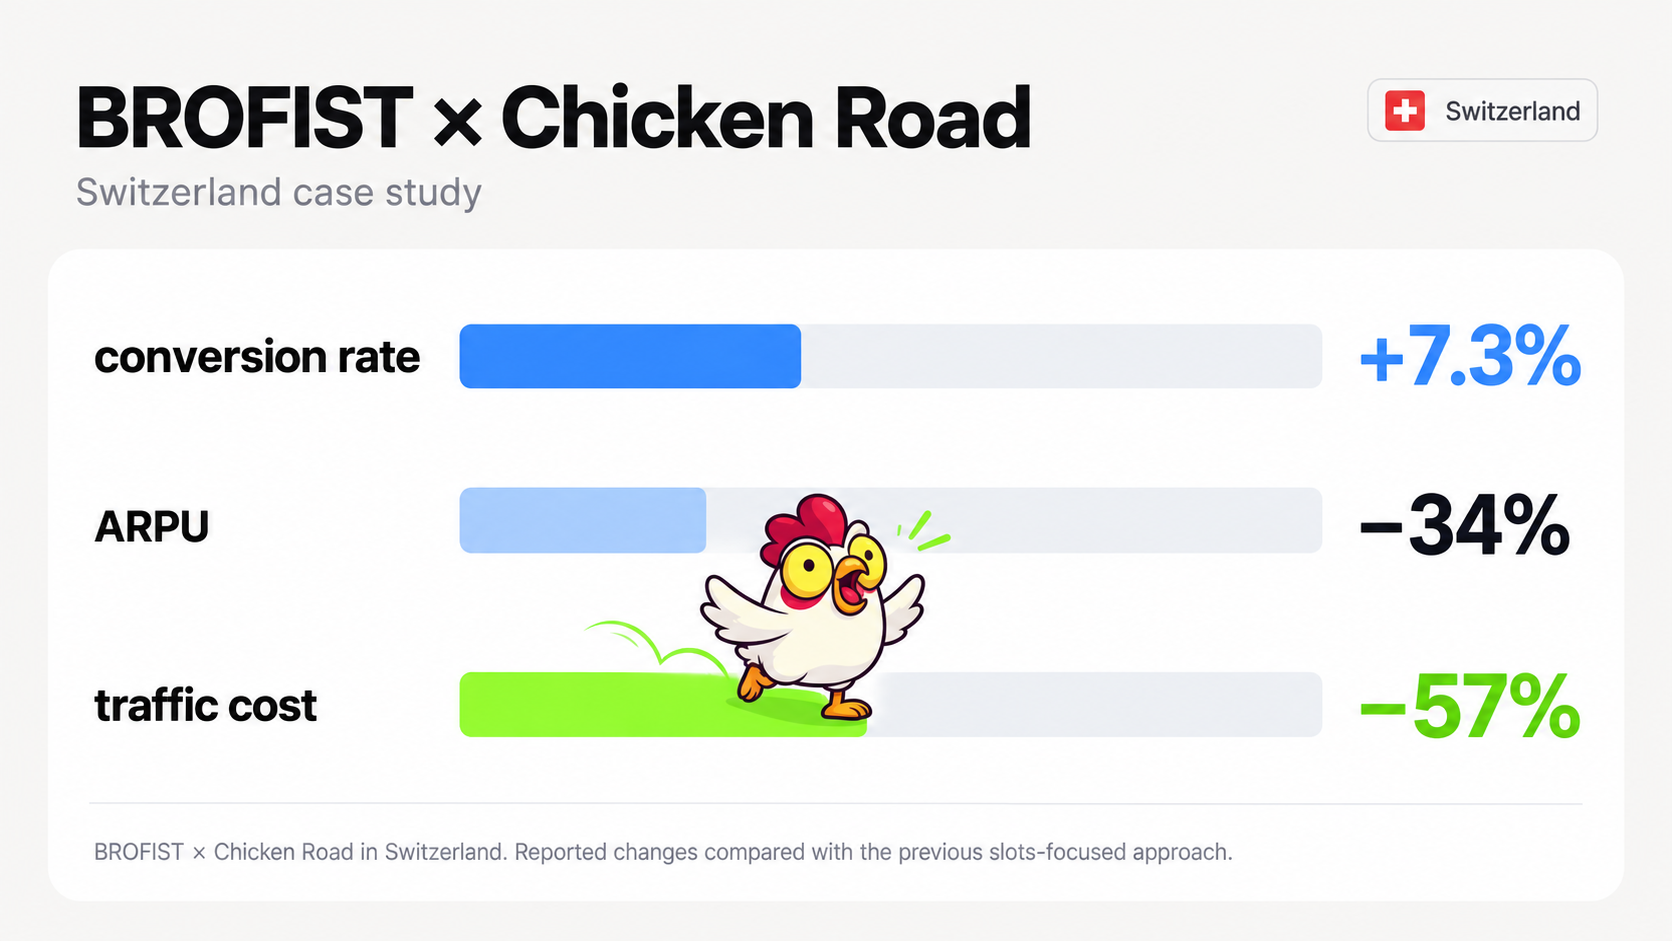
According to BROFIST’s published results, the experiment produced three changes compared with its previous approach.
| Metric | Reported change |
|---|---|
| Conversion rate | +7.3% |
| ARPU | −34% |
| Traffic cost | −57% |
Source: BROFIST, published case summary. The reported percentages are comparative changes, not percentage-point movements.
The most interesting figure is not the conversion increase. It is the combination of falling ARPU and substantially cheaper traffic.
An operator looking only at monetization per user might conclude that the new approach underperformed. But traffic cost fell by 57%, potentially making additional acquisition economically viable even with lower revenue per user.
The important qualification is that the published summary does not provide a complete contribution-margin calculation, a consistent cohort-level LTV comparison, or enough detail to establish the campaign’s final profitability.
The case nevertheless illustrates why ARPU cannot be used as an isolated success metric. Acquisition economics may improve even when average revenue per user decreases.
📚 Read more: Top casino games in Austria 2026: Chicken Road holds 14% of demand
Can revenue grow while ARPU falls?
Yes. A business can increase total revenue while generating less revenue per active user.
Consider a hypothetical operator that expands its audience through a lower-cost acquisition channel.
| Month | NGR | Active users | ARPU |
|---|---|---|---|
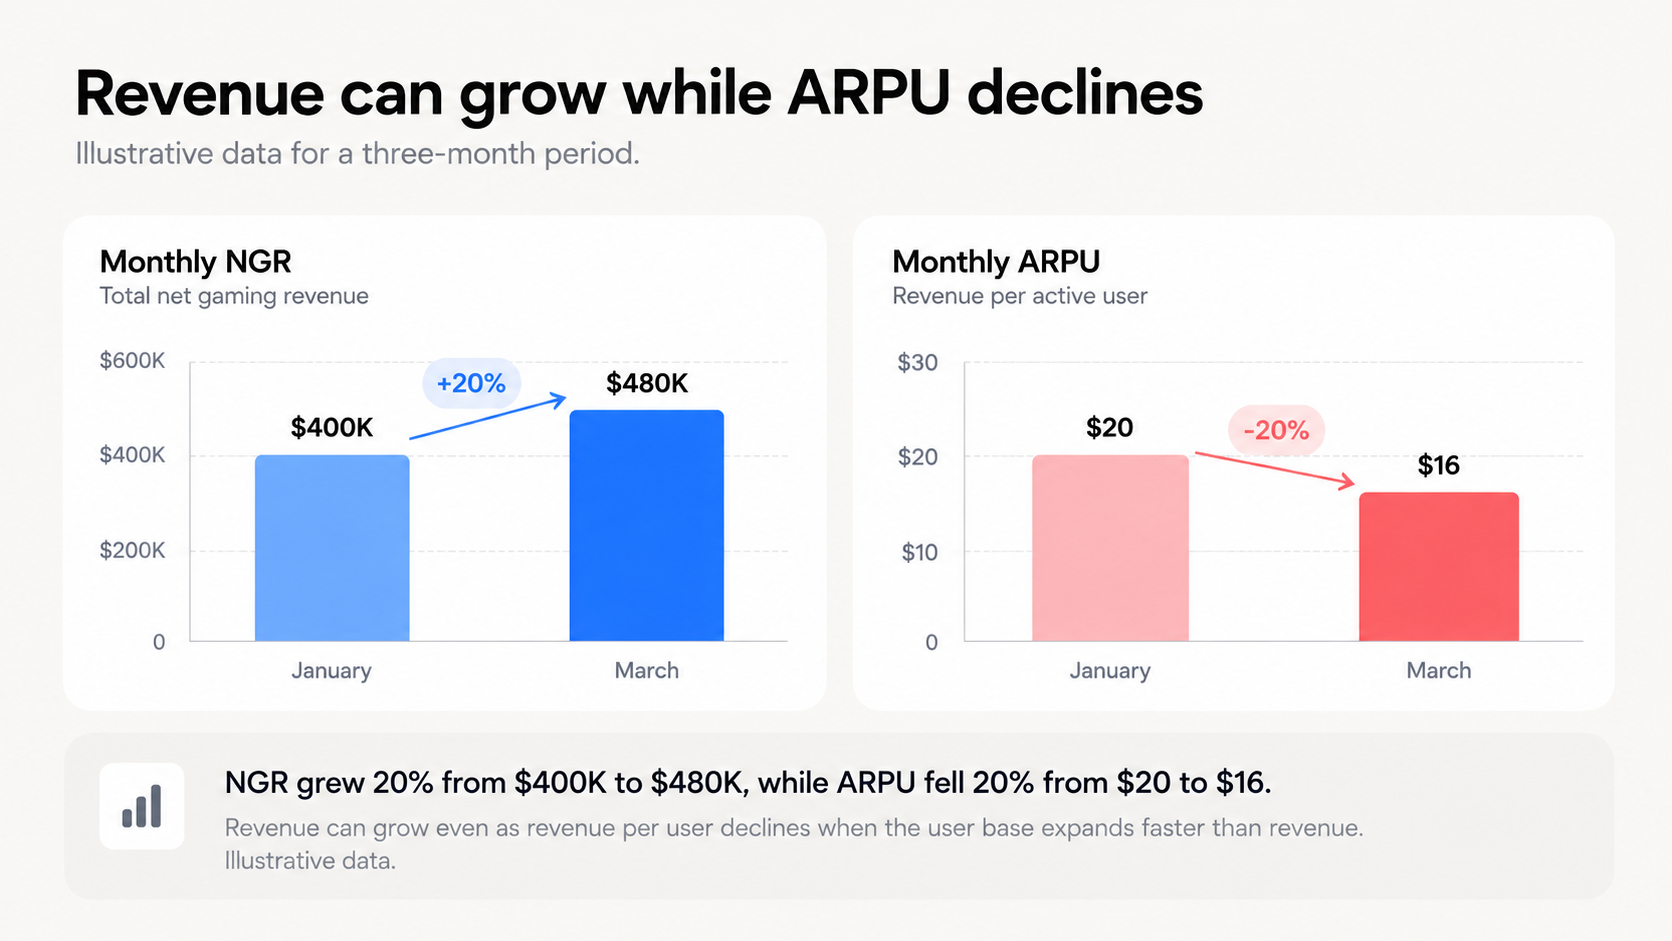
| January | $400,000 | 20,000 | $20 |
| February | $440,000 | 25,000 | $17.60 |
| March | $480,000 | 30,000 | $16 |
Between January and March, NGR grows by 20% and active users increase by 50%. ARPU consequently declines from $20 to $16.
The operator is larger and generating more revenue, but its average revenue per active user is lower.
This can be a reasonable trade-off if the new audience is acquired efficiently, retained, and generates sufficient long-term contribution. It becomes a concern if acquisition spending rises faster than the incremental value of those customers.
How to analyze ARPU by cohort, geography, and acquisition channel
A single brand-wide ARPU figure can conceal considerable differences in customer economics.
Cohort analysis is one way to identify them. Grouping players by registration or first-deposit month allows an operator to examine how revenue develops as customers mature.
For instance, one channel may acquire users who monetize quickly but disappear after several weeks. Another may deliver lower initial ARPU but stronger retention over six months. Comparing both groups at the same cohort age helps distinguish short-term revenue from longer-term value.
Geographic comparisons require similar caution. Operators should control for currency, product availability, regulatory conditions, and differences in user definitions before treating ARPU differences as evidence of market opportunity.
Product-level analysis can reveal additional variation. But when customers use both casino and sportsbook products, operators must avoid double-counting shared-wallet users in combined reporting.
Case study: Whale — ARPU as part of a different growth model
In March 2025, Blask co-founder Dmitry Belianin highlighted Whale as an example of a gambling brand built around a different approach to product, community, and acquisition.
At its second anniversary, the company reported 14.5 million registered users, an expansion from 316 to 3,000 games, and $88 million in USDT withdrawals during 2024.

The figures shared by Belianin also included $510 million in turnover, $14.5 million in GGR, CPA of €33, and ARPU of €51.
The reported CPA and ARPU figures are particularly interesting because they provide two sides of the acquisition equation: the cost of bringing in a customer and the average revenue associated with the user base.
They cannot establish payback on their own. The published figures do not specify an aligned cohort and reporting window, so subtracting CPA from ARPU would not produce a valid profit calculation.
For Belianin, Whale’s growth was notable because of the business model behind it.
Whale’s community-led approach provides an alternative to competing primarily through conventional advertising. Membership benefits, online-to-offline experiences, and product differentiation can all contribute to why people discover and remain connected to a brand. The case does not prove that community-led acquisition universally delivers higher ARPU. It shows why ARPU should be interpreted alongside the costs and mechanisms of customer acquisition.
Dmitry Belianin
How operators use ARPU for business decisions
ARPU connects revenue reporting with acquisition, retention, and product strategy, but its usefulness depends on the question being asked.
- For acquisition teams, the important comparison is not simply which channel produces the highest ARPU. It is which channel generates sufficient long-term revenue relative to acquisition and servicing costs.
- For CRM teams, ARPU can help identify whether a campaign’s revenue growth reflects additional paying customers or changes in revenue from existing customers. Controlled experiments are preferable to assuming the campaign caused every observed change.
- For finance teams, ARPU supports scenario modeling. An operator expecting 100,000 monthly active users at $20 ARPU can model $2 million in monthly revenue. But that forecast remains sensitive to player mix, product margins, and the assumptions behind both inputs.
ARPU is therefore an input into business planning, not a substitute for contribution margin, cash flow, or LTV.
📚 Read more: Customer acquisition cost in iGaming counts more than the media invoice
How to increase ARPU in iGaming
There are several ways to improve ARPU without treating higher player spending as the only objective.
- One is to improve the conversion journey. Technical failures, confusing verification steps, and payment problems can prevent otherwise eligible customers from completing registration and payment processes. Removing unnecessary friction can improve commercial performance and customer experience.
- Another is to improve retention through product reliability, relevant communication, and responsive support. Retaining satisfied customers can reduce dependence on continual acquisition, although outcomes should still be assessed against actual costs and customer protection measures.
- Operators can also evaluate product mix and discovery. Better navigation, localized content, and clearer game categorization may help customers find relevant products.
- CRM campaigns require particular care. A short-term ARPU increase driven by aggressive incentives is not necessarily sustainable when promotional deductions, churn, or safer-gambling risks are considered.
The objective should be sustainable value across the customer base, not maximum revenue from vulnerable individuals.
Common ARPU calculation mistakes
ARPU is easy to calculate incorrectly because revenue and user counts often come from different systems.
One frequent error is dividing monthly revenue by total registered accounts when the intended metric is revenue per monthly active user. Another is switching from GGR to NGR without identifying a reporting break.
Operators may also count active sessions instead of unique people, add monthly user counts together when calculating quarterly ARPU, or aggregate casino and sportsbook audiences without deduplicating shared-wallet customers.
A less obvious problem is interpreting every ARPU decrease as deterioration. The BROFIST example illustrates why a reduction may accompany a more efficient traffic strategy. The correct assessment requires acquisition cost, retention, and incremental revenue data.
What is a good ARPU in iGaming?
There is no universal ARPU benchmark that applies to all online casinos and sportsbooks.
ARPU varies with market structure, audience definition, product mix, reporting period, and revenue methodology. A mature operator with a concentrated base of established customers may report a very different figure from a recently launched brand acquiring a large new audience.
Public figures are also difficult to compare without knowing whether the denominator includes registered users, monthly active users, paying users, or another population.
A useful benchmark is therefore one that uses comparable definitions and operating conditions. Internal cohort comparisons often provide stronger evidence than an unsourced industry average.
How Blask complements operator ARPU analysis
ARPU describes realized revenue relative to an operator’s user base. It normally requires internal player and financial records.
Blask provides a different perspective: external market and brand intelligence that can help operators interpret their commercial environment.
Blask Index measures market and brand demand, while Brand’s Accumulated Power (BAP) describes a brand’s share of measured market demand. Acquisition Power Score (APS) estimates potential new customers, and Competitive Earning Baseline (CEB) provides a modeled earnings range.
These are not direct ARPU inputs. APS is not an observed count of active or paying users, and CEB is not the operator’s reported GGR or NGR.
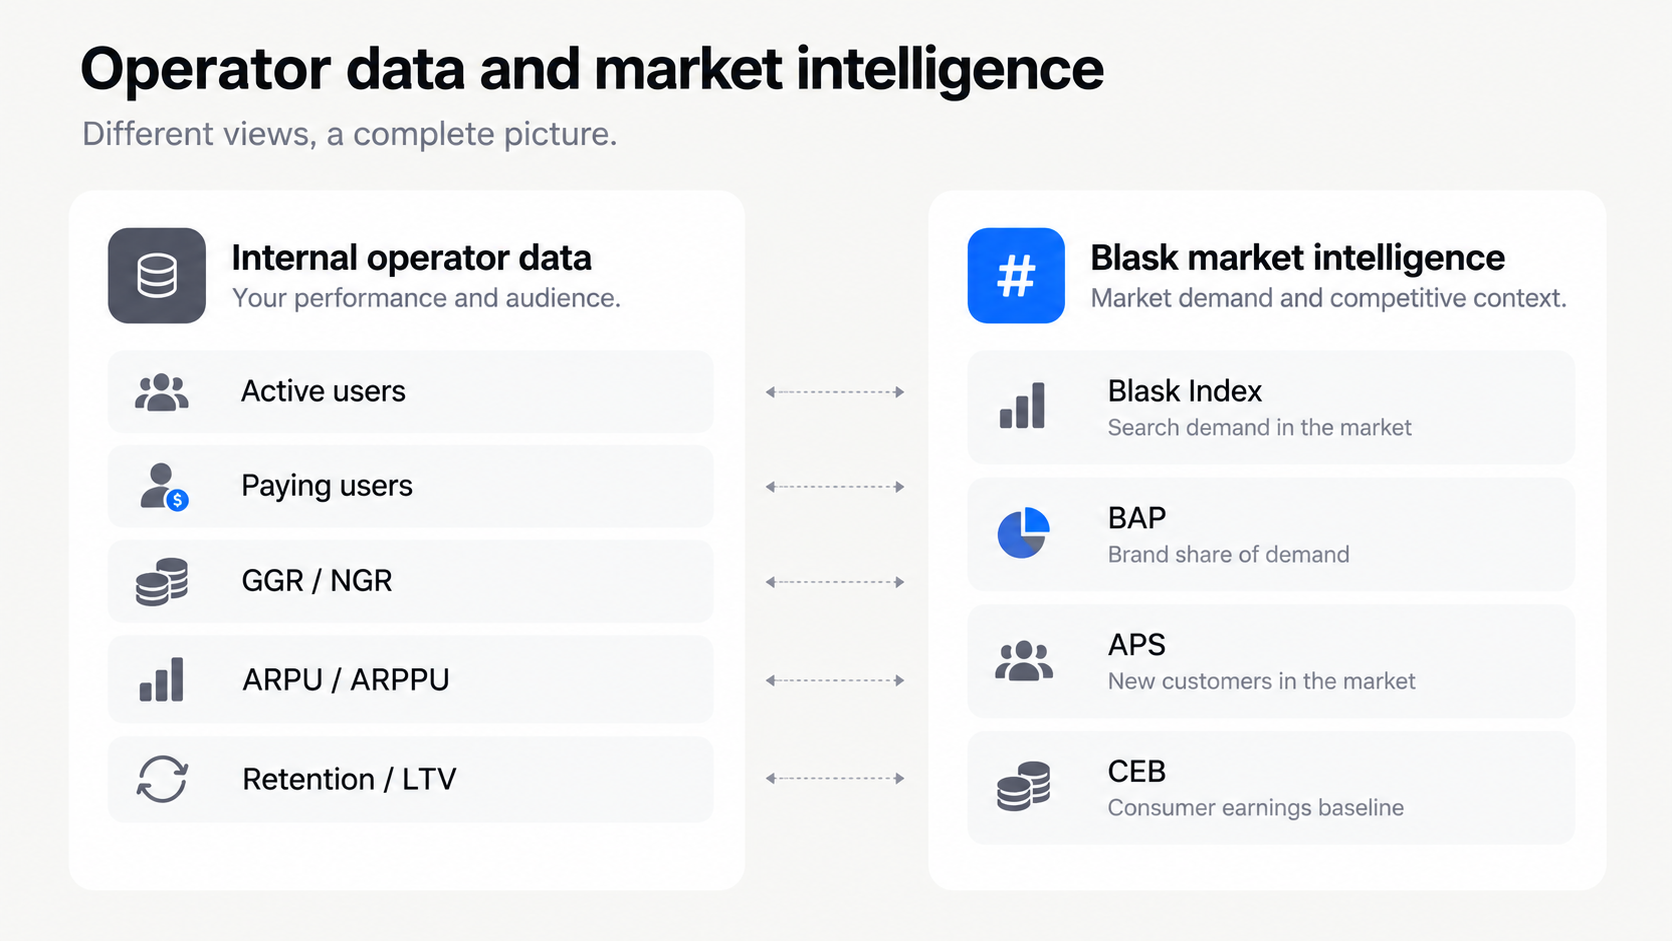
An operator may observe declining ARPU while external demand for its brand rises. This could indicate that the user base is expanding faster than monetization, although internal data would be needed to confirm the explanation.
Conversely, a brand may maintain ARPU while losing share of market demand. Stable monetization among existing customers would not necessarily mean its competitive position is improving.
Used together, the two perspectives help distinguish internal customer economics from external market performance.
Best practices for tracking ARPU
A reliable ARPU reporting process starts with consistent definitions. Teams should document what counts as revenue, what counts as a user, and which reporting period each figure represents.
ARPU should then be analyzed alongside active users, payer conversion, ARPPU, retention, LTV, acquisition cost, and contribution margin.
The most important step is investigating the source of change. When ARPU rises, determine whether more users became payers, revenue per payer increased, or the composition of the audience shifted. When ARPU falls, assess whether the decrease reflects weaker performance or a deliberate expansion into lower-cost audiences.
The metric is most useful when it leads to a better business question rather than a simple judgment based on the direction of the number.
Frequently asked questions about ARPU
What does ARPU stand for?
ARPU stands for Average Revenue Per User. It measures average revenue generated per user over a defined reporting period.
How do you calculate ARPU in iGaming?
Divide the selected revenue measure, usually GGR or NGR, by the number of users in the defined reporting population. For example, $200,000 in monthly NGR divided by 10,000 monthly active users produces ARPU of $20.
What is the difference between ARPU and ARPPU?
ARPU includes all users in the defined population, including those who do not pay. ARPPU includes only paying users. Both require consistent revenue and reporting definitions.
Can ARPU fall while revenue increases?
Yes. If the user population grows faster than revenue, ARPU decreases even when total revenue rises. This may happen during rapid audience expansion or a change in acquisition strategy.
Is higher ARPU always better?
No. High ARPU may accompany strong monetization, but it can also reflect a shrinking user base, revenue concentration, or unusually favorable gaming outcomes. Acquisition efficiency, profitability, and responsible gambling considerations remain important.
How often should ARPU be calculated?
Monthly ARPU is commonly useful for operator reporting. Daily and weekly calculations help investigate short-term events, while quarterly analysis provides a broader view. The user definition must remain consistent within each reporting series.
Is ARPU the same as lifetime value?
No. ARPU describes revenue per user over a period. LTV measures accumulated or expected customer value over a longer relationship, including the effects of retention and, depending on the model, associated costs.
Can ARPU be negative?
Yes. If the selected gaming revenue measure is negative during a period, calculated ARPU can also be negative. Player wins and relevant deductions can contribute to negative gaming revenue.
Does Blask provide ARPU data?
Blask does not publish operator-level ARPU. It provides external market intelligence, including demand, brand positioning, acquisition potential, and modeled earnings, which can complement internal operator monetization analysis.