
- Updated:
- Published:
iGaming market growth by region: H1 2026 split the map

A 58.4 percentage-point gap separated the strongest and weakest demand shifts in this five-market benchmark. Revenue potential followed a wider range.
There was no single iGaming industry growth rate in H1 2026. Blask data for the United Kingdom, United States, Nigeria, Brazil and Germany shows three paths: demand expansion, demand contraction and revenue potential moving apart from attention.
The comparison uses Blask Index to measure consumer search demand. Competitive Earning Baseline (CEB) is Blask’s modelled revenue benchmark, not operator-reported GGR. Brand Accumulated Power (BAP) shows each operator’s share of demand within a market.
iGaming market growth by region in H1 2026
Demand growth ranged from +46.8% in Nigeria to −11.6% in Germany. Brazil and the UK expanded between those endpoints, while the US joined Germany in contraction.
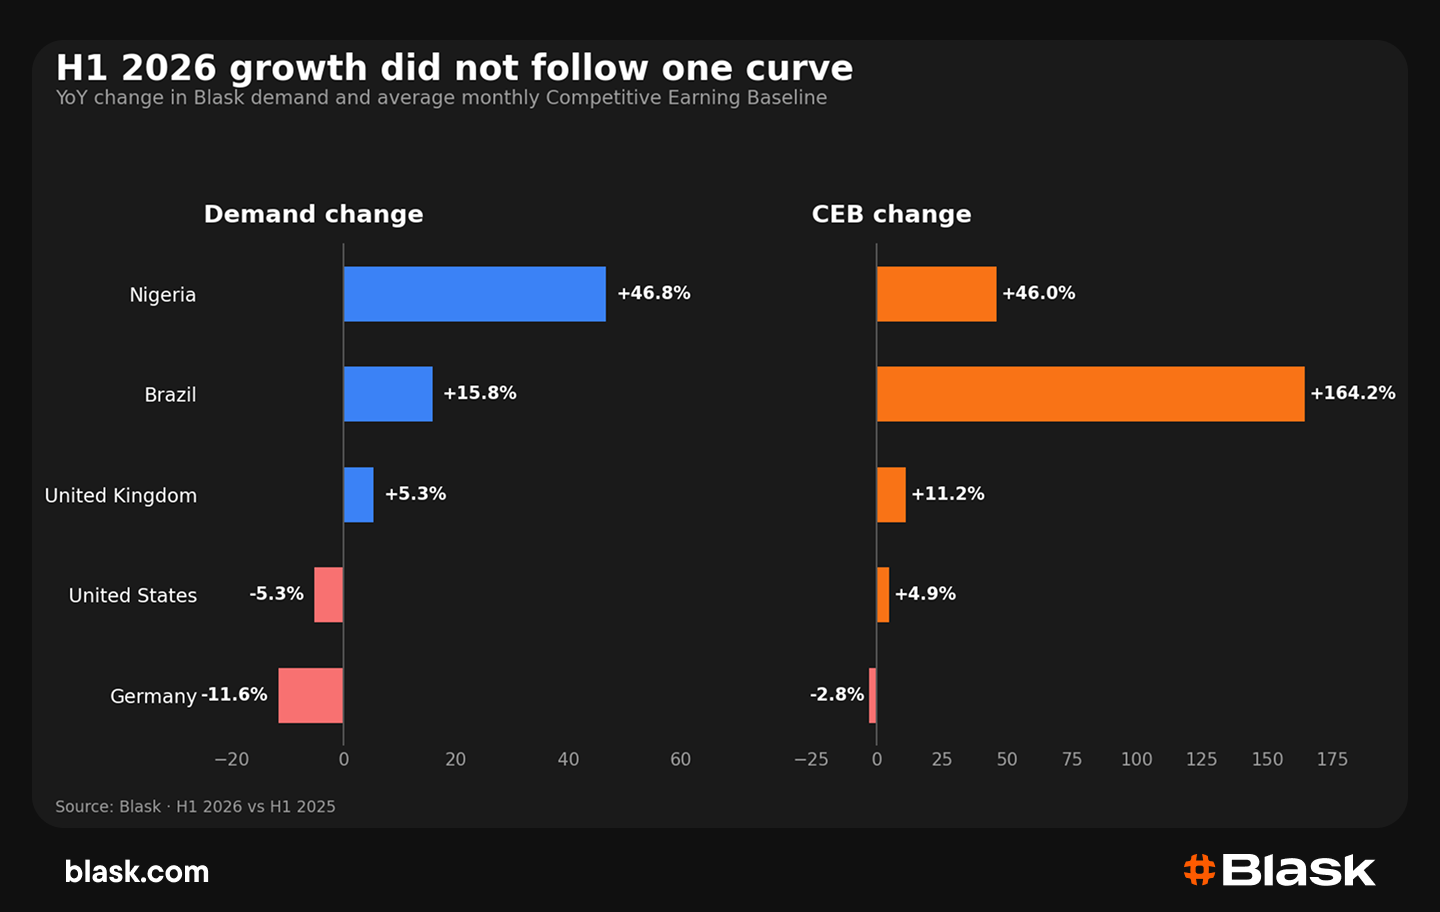
CEB followed demand in Nigeria and the UK, but the relationship broke elsewhere. Brazil’s average monthly baseline rose 164.2% after the regulated market completed its first full half-year comparison. US CEB gained despite lower demand, while Germany’s baseline fell 2.8% against an 11.6% drop in attention.
| Market | Demand YoY | CEB YoY | Average monthly CEB | Onshore demand | Demand leader |
|---|---|---|---|---|---|
| Nigeria | +46.8% | +46.0% | $68.1M ($50.8M–$120.0M) | 99.0% | SportyBet, 41.0% BAP |
| Brazil | +15.8% | +164.2% | $1.13B ($836.2M–$2.00B) | 95.7% | Betano, 25.9% BAP |
| United Kingdom | +5.3% | +11.2% | $985.7M ($707.5M–$1.82B) | 96.8% | Bet365, 11.6% BAP |
| United States | −5.3% | +4.9% | $6.78B ($3.94B–$15.28B) | 21.9% | Bovada, 15.5% BAP |
| Germany | −11.6% | −2.8% | $198.8M ($131.6M–$400.5M) | 67.5% | Tipico, 20.7% BAP |
The five markets do not form a global forecast. They show why a regional projection based on one growth rate misses the main split: player demand, licensing and revenue potential changed at different speeds.
Nigeria: demand rose 46.8% and the leader changed
Nigeria posted the strongest expansion in the comparison. Demand rose 46.8% year over year and average monthly CEB increased 46.0% to $68.1M ($50.8M–$120.0M). The close match between the two rates separates Nigeria from Brazil and the US, where demand and CEB diverged.
SportyBet replaced Bet9ja as the demand leader. SportyBet held 41.0% BAP in H1 2026, while Bet9ja had led the same period a year earlier with 39.7%. The result was a leadership flip inside a growing market, not growth captured by one incumbent alone.
The licence split changed by 0.1 percentage points: onshore brands held 99.0% of demand and 98.4% of CEB. Nigeria’s regulatory structure did change around the period. A 2024 Supreme Court ruling moved gambling authority to the states, and 22 state regulators signed a reciprocal licensing framework in May 2025. Existing national licensees were due to renew under that framework from 1 January 2026. Blask data cannot assign the demand increase to that change, but it places the growth inside a market where onshore brands held 99% of attention.
Brazil: regulation changed the revenue baseline
Brazilian demand grew 15.8%, but average monthly CEB climbed 164.2% to $1.13B ($836.2M–$2.00B). The difference does not mean reported market revenue tripled. Brazil’s first full regulated comparison requires CEB and demand to be read as separate measures.
Federal rules have required prior SPA authorisation since 1 January 2025, and authorised national domains use the .bet.br extension. The contribution applied to operators’ gross gaming revenue rose to 13% for 2026.
The Blask split moved in the same direction. Onshore brands captured 95.7% of demand and 96.6% of CEB in H1 2026. Betano extended its lead to 25.9% BAP, up 5.5 percentage points year over year. The full Brazil H1 analysis shows how licensed leaders captured most of that growth.
United Kingdom: moderate growth, new leader
UK demand rose 5.3% year over year, while average monthly CEB gained 11.2% to $985.7M ($707.5M–$1.82B). Both measures expanded, but the ranking changed: Bet365 took first place with 11.6% BAP after William Hill led H1 2025 with 11.7%.
The half also crossed a major tax boundary. Remote Gaming Duty increased from 21% to 40% on 1 April 2026 [4]. H1 therefore contains three months before the increase and three months after it. The aggregate does not isolate the tax effect, but the leadership flip landed during the rate change.
The market remained 96.8% onshore by demand. Offshore brands held only 3.2% of attention but 12.9% of CEB, a wider revenue footprint than their search share. The UK H1 analysis examines that split and the brand movements behind the total.
United States: regulated revenue grew while total demand fell
US demand fell 5.3%, yet average monthly CEB rose 4.9% to $6.78B ($3.94B–$15.28B). Bovada remained the national demand leader at 15.5% BAP, down 0.8 percentage points from H1 2025.
The licence split explains why national Blask demand and regulated revenue can move in opposite directions. Offshore brands accounted for 78.1% of demand and 67.4% of CEB in H1 2026. Onshore operators held 21.9% of attention.
Licensed online casino revenue still expanded. The American Gaming Association reported $3.03B in Q2 2026 iGaming revenue, up 16.5% year over year, across the states in its commercial tracker. That figure covers regulated transactions; Blask measures demand across licensed and offshore brands nationwide. The two results describe different layers of the market. A separate state-level Blask analysis found the largest recent demand losses among licensed operators.
Germany: total demand fell as onshore share increased
Germany recorded the steepest demand decline in the comparison at 11.6%. Average monthly CEB fell by a smaller 2.8% to $198.8M ($131.6M–$400.5M), while Tipico led with 20.7% BAP.
The licence mix moved toward regulated operators even as the market contracted. Onshore demand rose from 51.1% in H1 2025 to 67.5% in H1 2026. Its share of CEB increased from 57.7% to 64.8%. Germany therefore lost attention but channelled more of what remained toward licensed brands.
The GGL’s activity report, published on 3 July 2026, cited a 2024 study that put regulated online gambling at 77% of market volume. That estimate measures gambling volume through a different method and period, so it is not interchangeable with Blask demand share. Both point in the same direction: the legal segment has gained weight, while a material offshore market remains.
What separated the five markets
The strongest divide was not Europe versus emerging markets. It was the relationship between demand and monetisation.
Nigeria combined demand growth, CEB growth and an onshore share near 99%. Brazil combined moderate demand growth with a step-change in its regulated revenue baseline. The UK posted 5.3% demand growth and changed leader during a tax reset. US demand contracted while regulated iGaming revenue and total CEB rose. Germany lost demand but increased the onshore share of the remaining market.
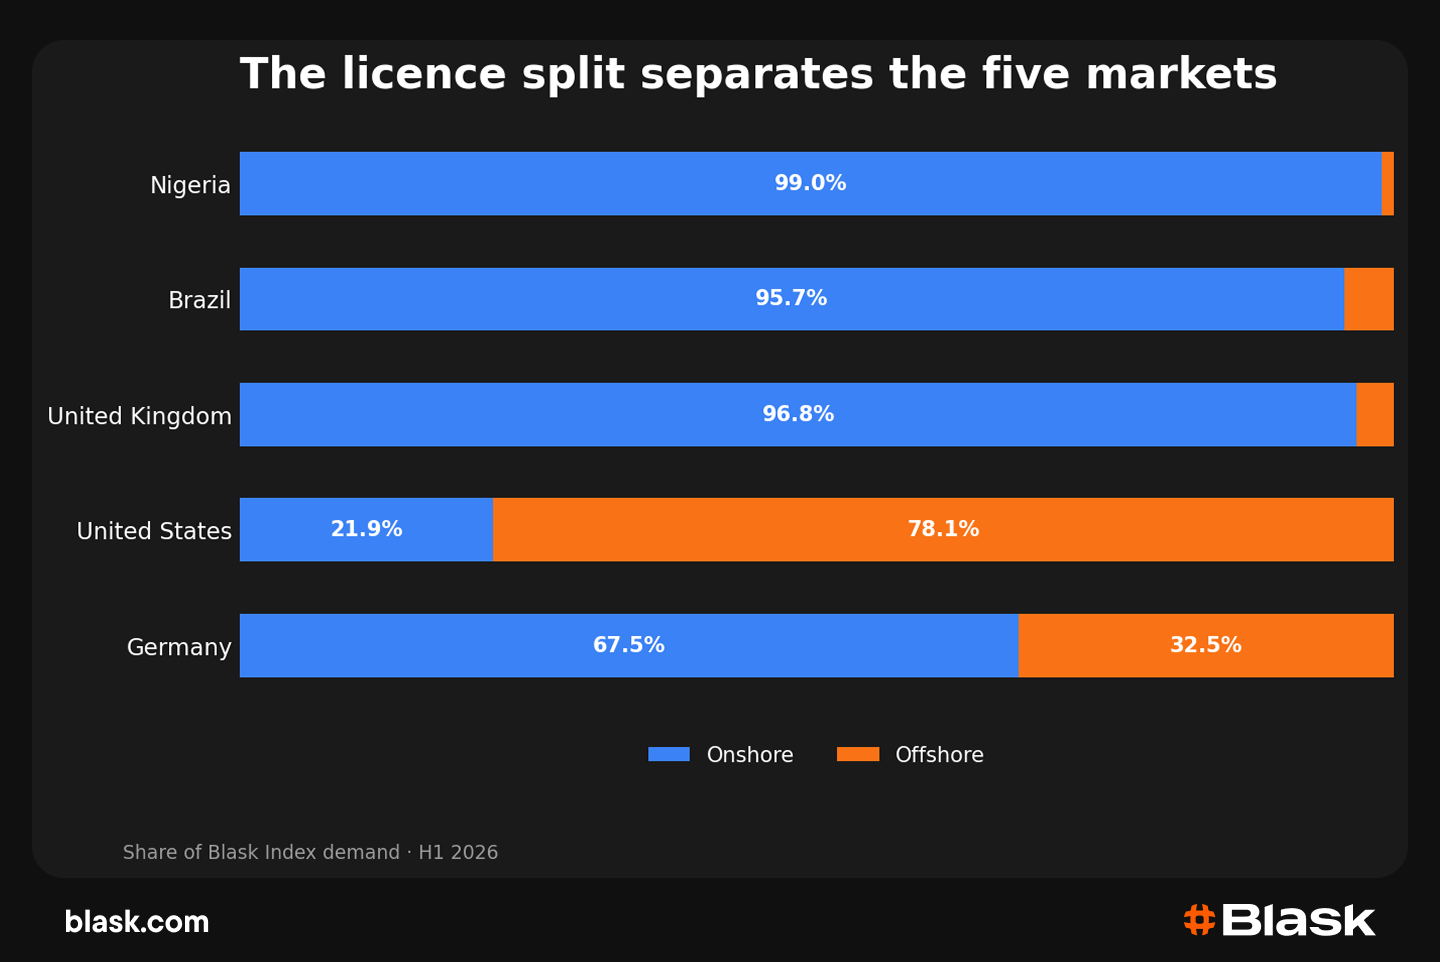
The licence lens also prevents a false regional comparison. Nigeria, Brazil and the UK were more than 95% onshore by demand. Germany sat at 67.5%. The US reversed the ratio, with offshore brands holding 78.1%. Blask’s cross-market concentration analysis adds a second distinction: markets with similar growth can still distribute demand across brands in very different ways.
FAQ
What was the iGaming industry growth rate in H1 2026?
There was no single rate across the five benchmark markets. Blask demand rose 46.8% in Nigeria, 15.8% in Brazil and 5.3% in the UK. It fell 5.3% in the US and 11.6% in Germany.
Which markets grew fastest in H1 2026?
Nigeria recorded the fastest demand growth among the five markets analysed. Brazil ranked second by demand growth, while its CEB increased the most after the market moved into its first full regulated comparison.
How does Blask measure regional iGaming growth?
Blask Index tracks changes in consumer search demand for gambling brands. BAP measures each brand’s share of that demand. CEB estimates a revenue range based on competitive position and market conditions; it is not operator-reported GGR.
Bottom line
H1 2026 split the five markets into three groups: demand and CEB rose together in Nigeria and the UK, Brazil entered its first full regulated comparison, and demand contracted in the US and Germany. The sharpest divide sat in licensing, with the US offshore-led and the other four markets shifting or holding toward onshore demand.