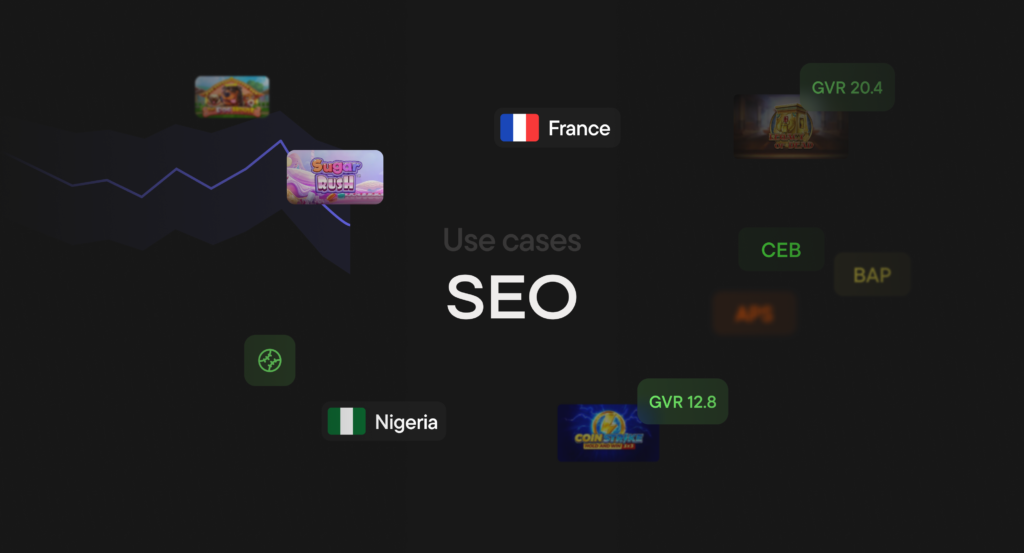
Resources

Blask Metrics

5 signs iGaming brands lose Market Share

The early warning lights that any iGaming brand is ceding ground almost always flash first inside its data, long before revenue lines sag. Blask’s real-time dashboards surface those signals in five interlocking metrics: the All-Brands table that captures every competitor on the map, Brand’s Accumulated Power (BAP), Blask Index, Acquisition Power Score (APS) and Competitive […]

The two-lens dashboard: GGR (orange) plotted against Blask’s green CEB corridor.
GGR vs CEB: iGaming revenue analytics

GGR tells you what you earned; CEB tells you what you should earn next. By comparing yesterday’s revenue with Blask’s monthly three-tier forecast—and cross-checking APS and BAP—operators expose hidden leaks, benchmark rivals, and set board-ready targets that ride ahead of market turbulence.

Get your daily iGaming
insights to your mail

    Thank you!

    Enjoy new articles
    every week